Original Link: https://www.anandtech.com/show/18794/asrock-industrial-4x4-box7735ud5-review
ASRock Industrial 4X4 BOX-7735U UCFF PC Review: Zen 3+, RDNA2, and USB4 in a Potent Platform
by Ganesh T S on April 6, 2023 10:30 AM EST- Posted in
- Systems
- AMD
- UCFF
- USB4
- ASRock Industrial
- Rembrandt
- Ryzen 7000 Mobile
ASRock Industrial is one of the few vendors with a lineup of ultra-compact form-factor (UCFF) computing systems based on the latest Intel and AMD platforms. Their lineup of NUC clones - the NUC BOX series with Intel, and the 4X4 BOX series with AMD - has enjoyed significant market success, mainly due to their commitment to leading edge processors. The company introduced the 4X4 BOX-7000 series UCFF PCs based on AMD's Rembrandt-R SoCs in early February, and sent across their flagship SKU - the 4X4 BOX-7735U/D5 - to be put through our rigorous evaluation routine.
The 4X4 BOX-7735U/D5 is one of the first UCFF mini-PCs to rely on DDR5 SODIMMs, and it is the first AMD-based mini-PC in our labs to include USB4 functionality with PCIe tunneling. The process improvements in moving to Zen 3+ and a re-architected integrated GPU (RDNA2) should theoretically deliver significantly better performance and power efficiency for a range of workloads over the company's Cezanne-based flagship (4X4 BOX-5800U) from last year.
The Ryzen 7 7735U, despite being a Zen 3+ part, was actually introduced only in January 2023. With a TDP of 28W, this U series SKU is meant primarily for notebook platforms. However, its deployment in an actively cooled UCFF chassis has allowed ASRock Industrial to provide the end user with a bit of flexibility in terms of power consumption - and, as an extension, performance.
ASRock Industrial ships the 4X4 BOX-7735U/D5 in the 'Normal Mode' with AMD's suggested TDP of 28W. However, a toggle in the BIOS can push the system into a 'Performance Mode' with a souped-up TDP of 42W. This review explores the performance profile of the PC in both modes, and provides detailed insights into the differentiating aspects of AMD's Rembrandt-R in a UCFF mini-PC platform.
Introduction and Product Impressions
Ultra-compact form-factor (UCFF) systems have managed to successfully replace bulky tower desktops for many use-cases over the last decade. The category continues to experience growth in both home consumer and industrial settings. The B2B / industrial computing arms of many motherboard vendors have also started providing more attention to such systems. ASRock Industrial (spun out of ASRock's business unit in 2018) has been creating UCFF systems based on both AMD and Intel platforms since 2019. We have reviewed a number of systems from the company in the last couple of years, ranging from the 4X4 BOX-V1000M (based on the AMD Ryzen Embedded V1605B Zen SoC) to the NUCS BOX-1360P/D4 (based on the Intel Core i7-1360P Raptor Lake-P processor).
This review delves in detail into the company's flagship AMD UCFF offering for 2023 - the 4X4 BOX-7735U/D5. Based on AMD's high-end Rembrandt-R 28W offering (Ryzen 7 7735U), the new system is meant to be a follow-up to the Cezanne-based 4X4 BOX-5800U released last year. The Ryzen 7 7735U continues with the same 8C/16T configuration of the Ryzen 7 5800U. However, the fabrication process has moved from TSMC's 7nm to 6nm FinFET, allowing the Zen 3 microarchitecture to get rebranded as Zen 3+. The process change has resulted in better voltage-frequency curves, with the net result being higher clocks for better performance and improvements in energy efficiency. More importantly, AMD has re-architected the integrated GPU - moving from the Vega-based one in Cezanne to a RDNA2-based Radeon 680M in Rembrandt-R. This has allowed the company to reclaim ground lost to Intel when the latter introduces the new Xe architecture into Tiger Lake and later processors.
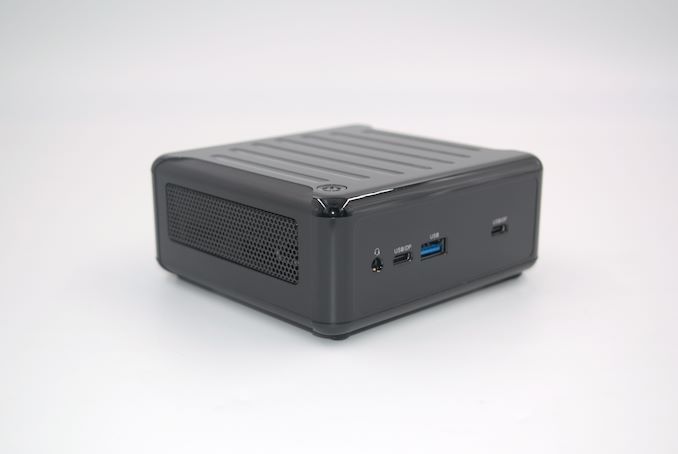
ASRock Industrial's UCFF systems are non-descript machines that do not opt for a fancy industrial design. The functional casing used in previous 4X4 BOX systems is retained for the 4X4 BOX-7735U/D5 also. While the Intel-based NUC(S) BOX lineup made the thankful move to matte polycarbonate for the chassis, the 4X4 BOX series continues to retain the glossy fingerprint magnet casing. The I/O port locations are exactly the same as in the previous generation, but the changes in Rembrandt-R has resulted in major updates to the internal board.
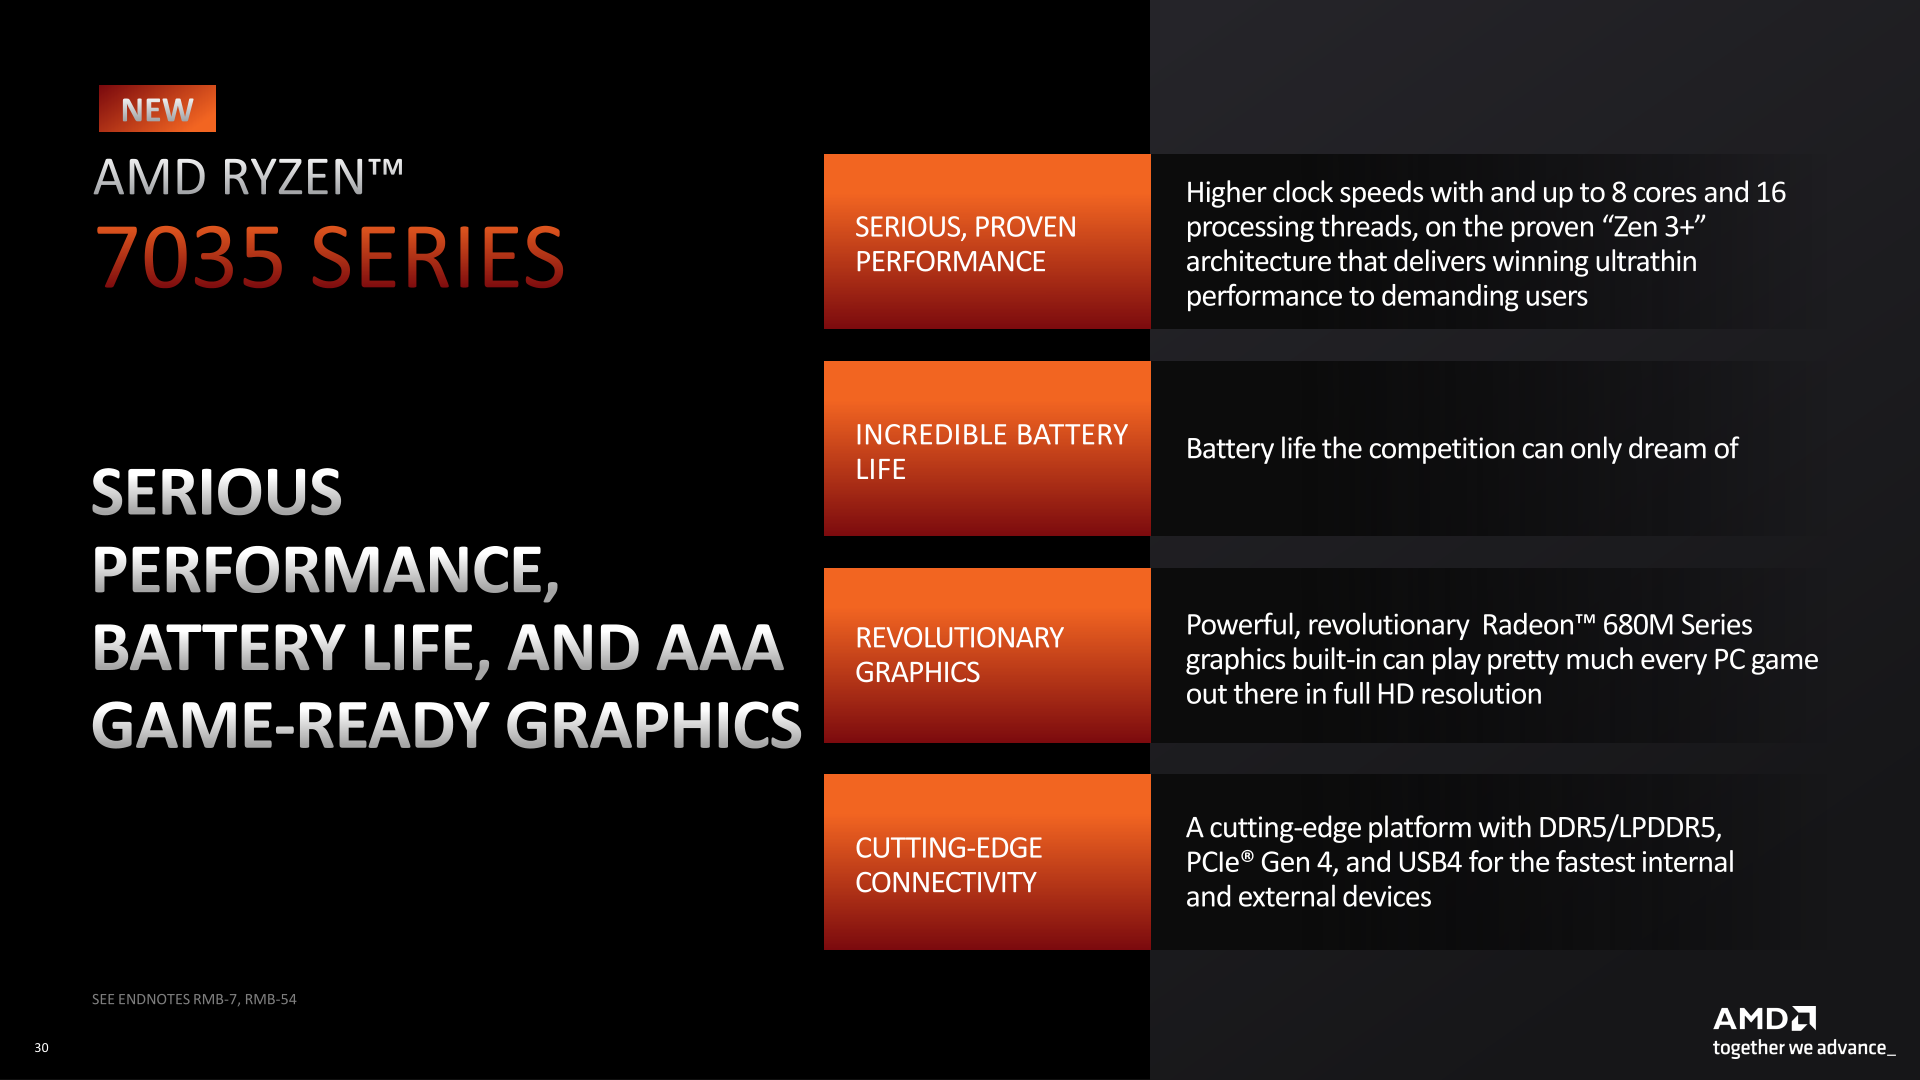
The company's 4X4 BOX-7000 series has only two members - one based on the Ryzen 7 7735U and the other based on the Ryzen 5 7535U. Some of the key relevant aspects are brought out in AMD's introductory slide to the product family back at the 2023 CES.
Unlike some of the other rebadges like Barcelo-R, Rembrandt-R supports only DDR5 and LPDDR5. For systems with user-replaceable memory like the 4X4 BOX-7000 series, DDR5 SODIMMs are the only option. The move to PCIe 4.0 means that the M.2 SSD slot on the board becomes capable of supporting Gen 4 SSDs. AMD also promises USB4 in the platform for fast external devices - and, as we shall see later on in this review, ASRock Industrial has configured the board components appropriately to enable this on both Type-C ports in the front panel.
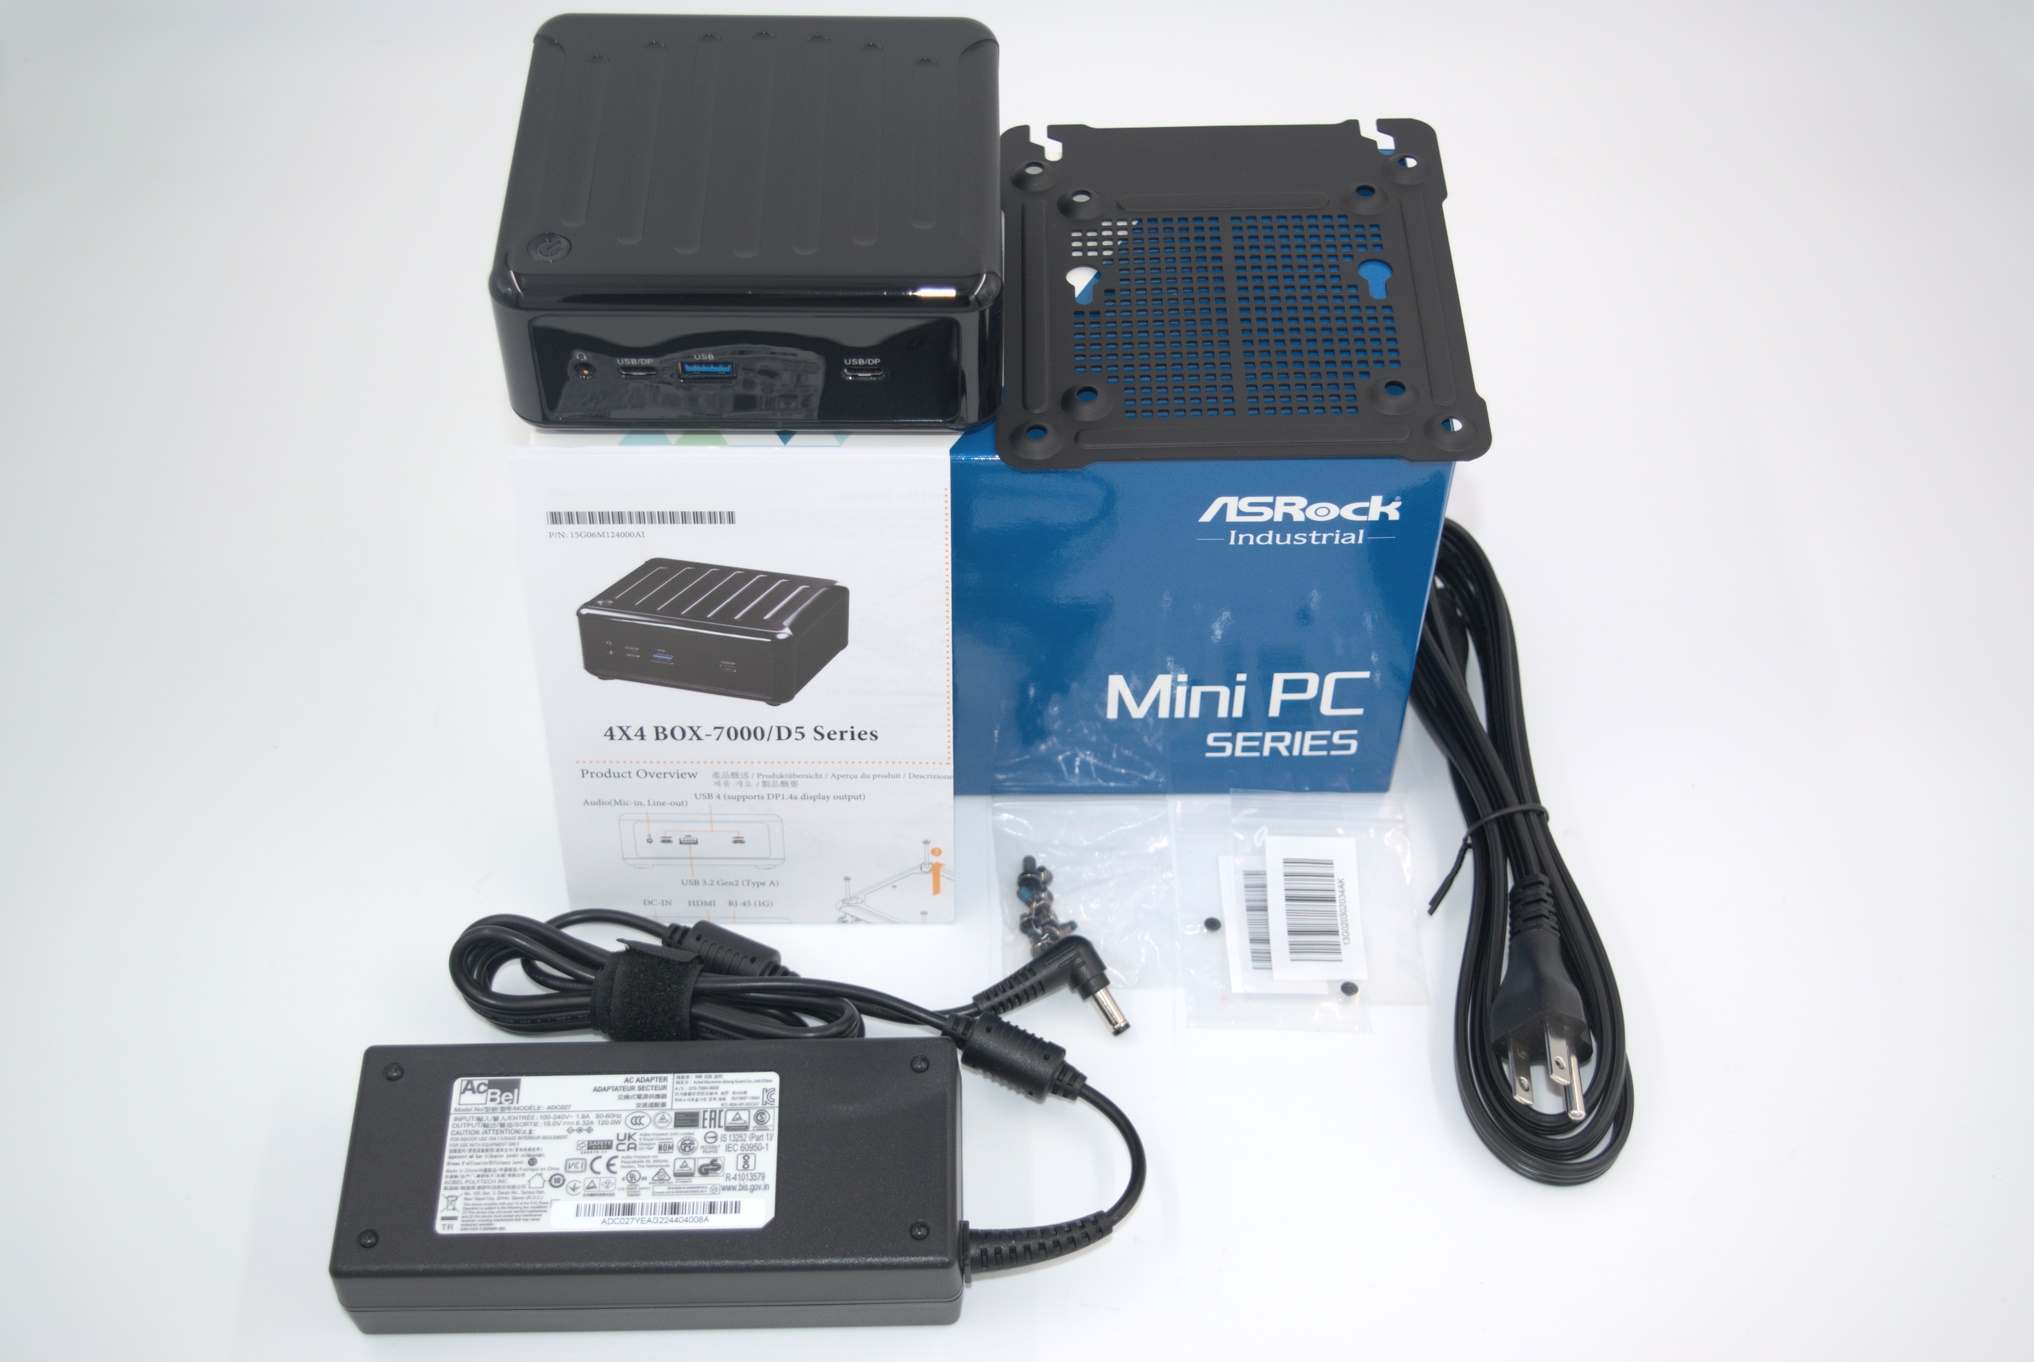
ASRock Industrial offers both barebones version of the system as well as the motherboard alone. The former is typically sold in the retail, while the latter is meant for the B2B channel. The barebones version package comes with a 120W DC power adapter (19V @ 6.32A), VESA mount (and associated screws), a geo-specific power cord, the main unit, and a product overview / user setup guide.
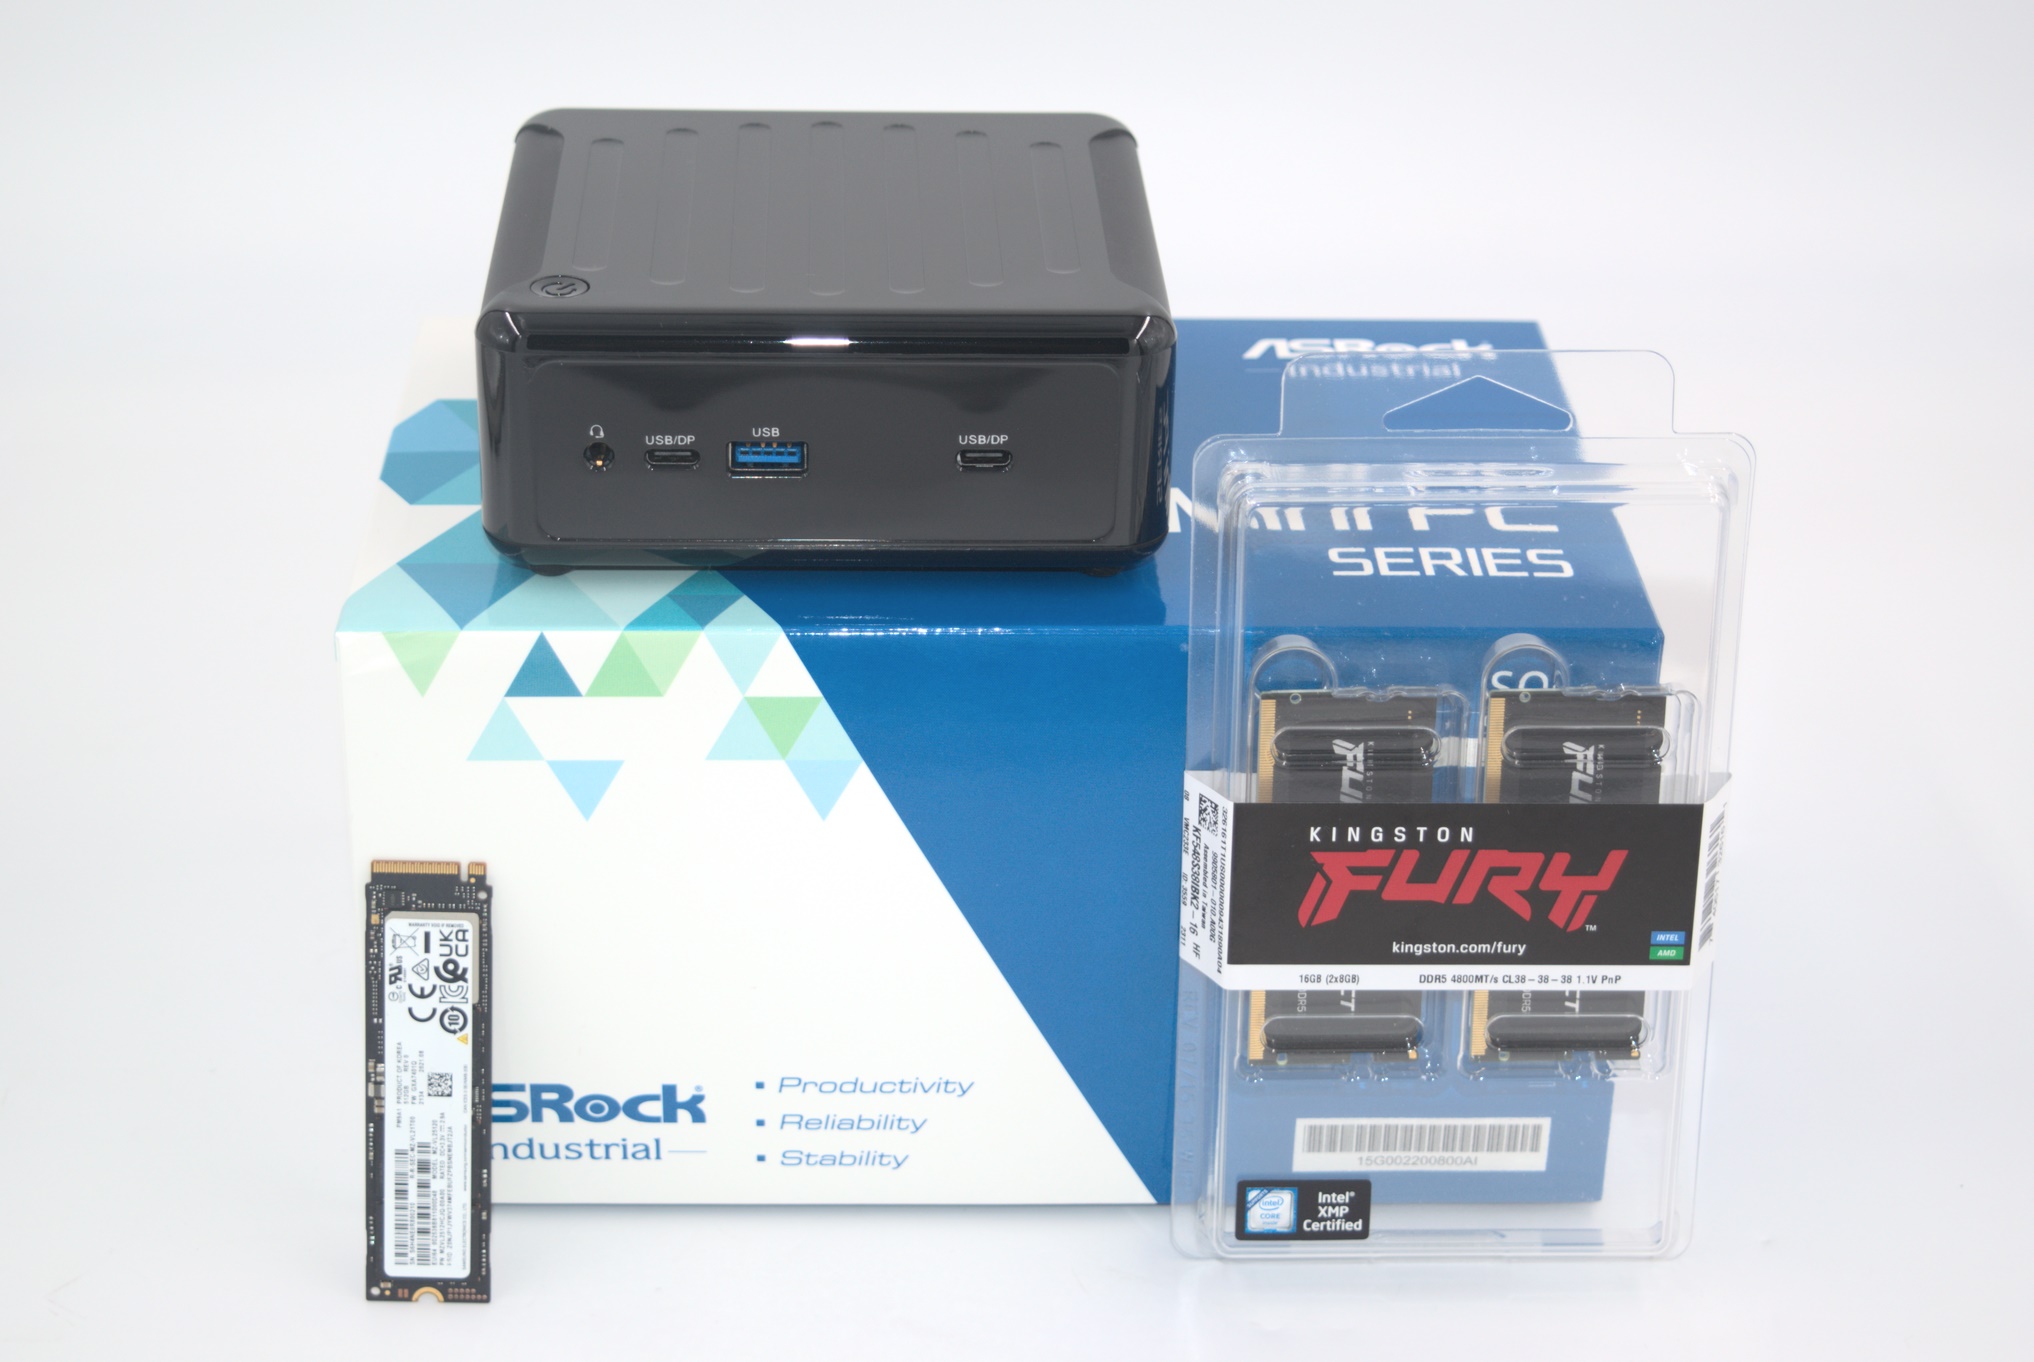
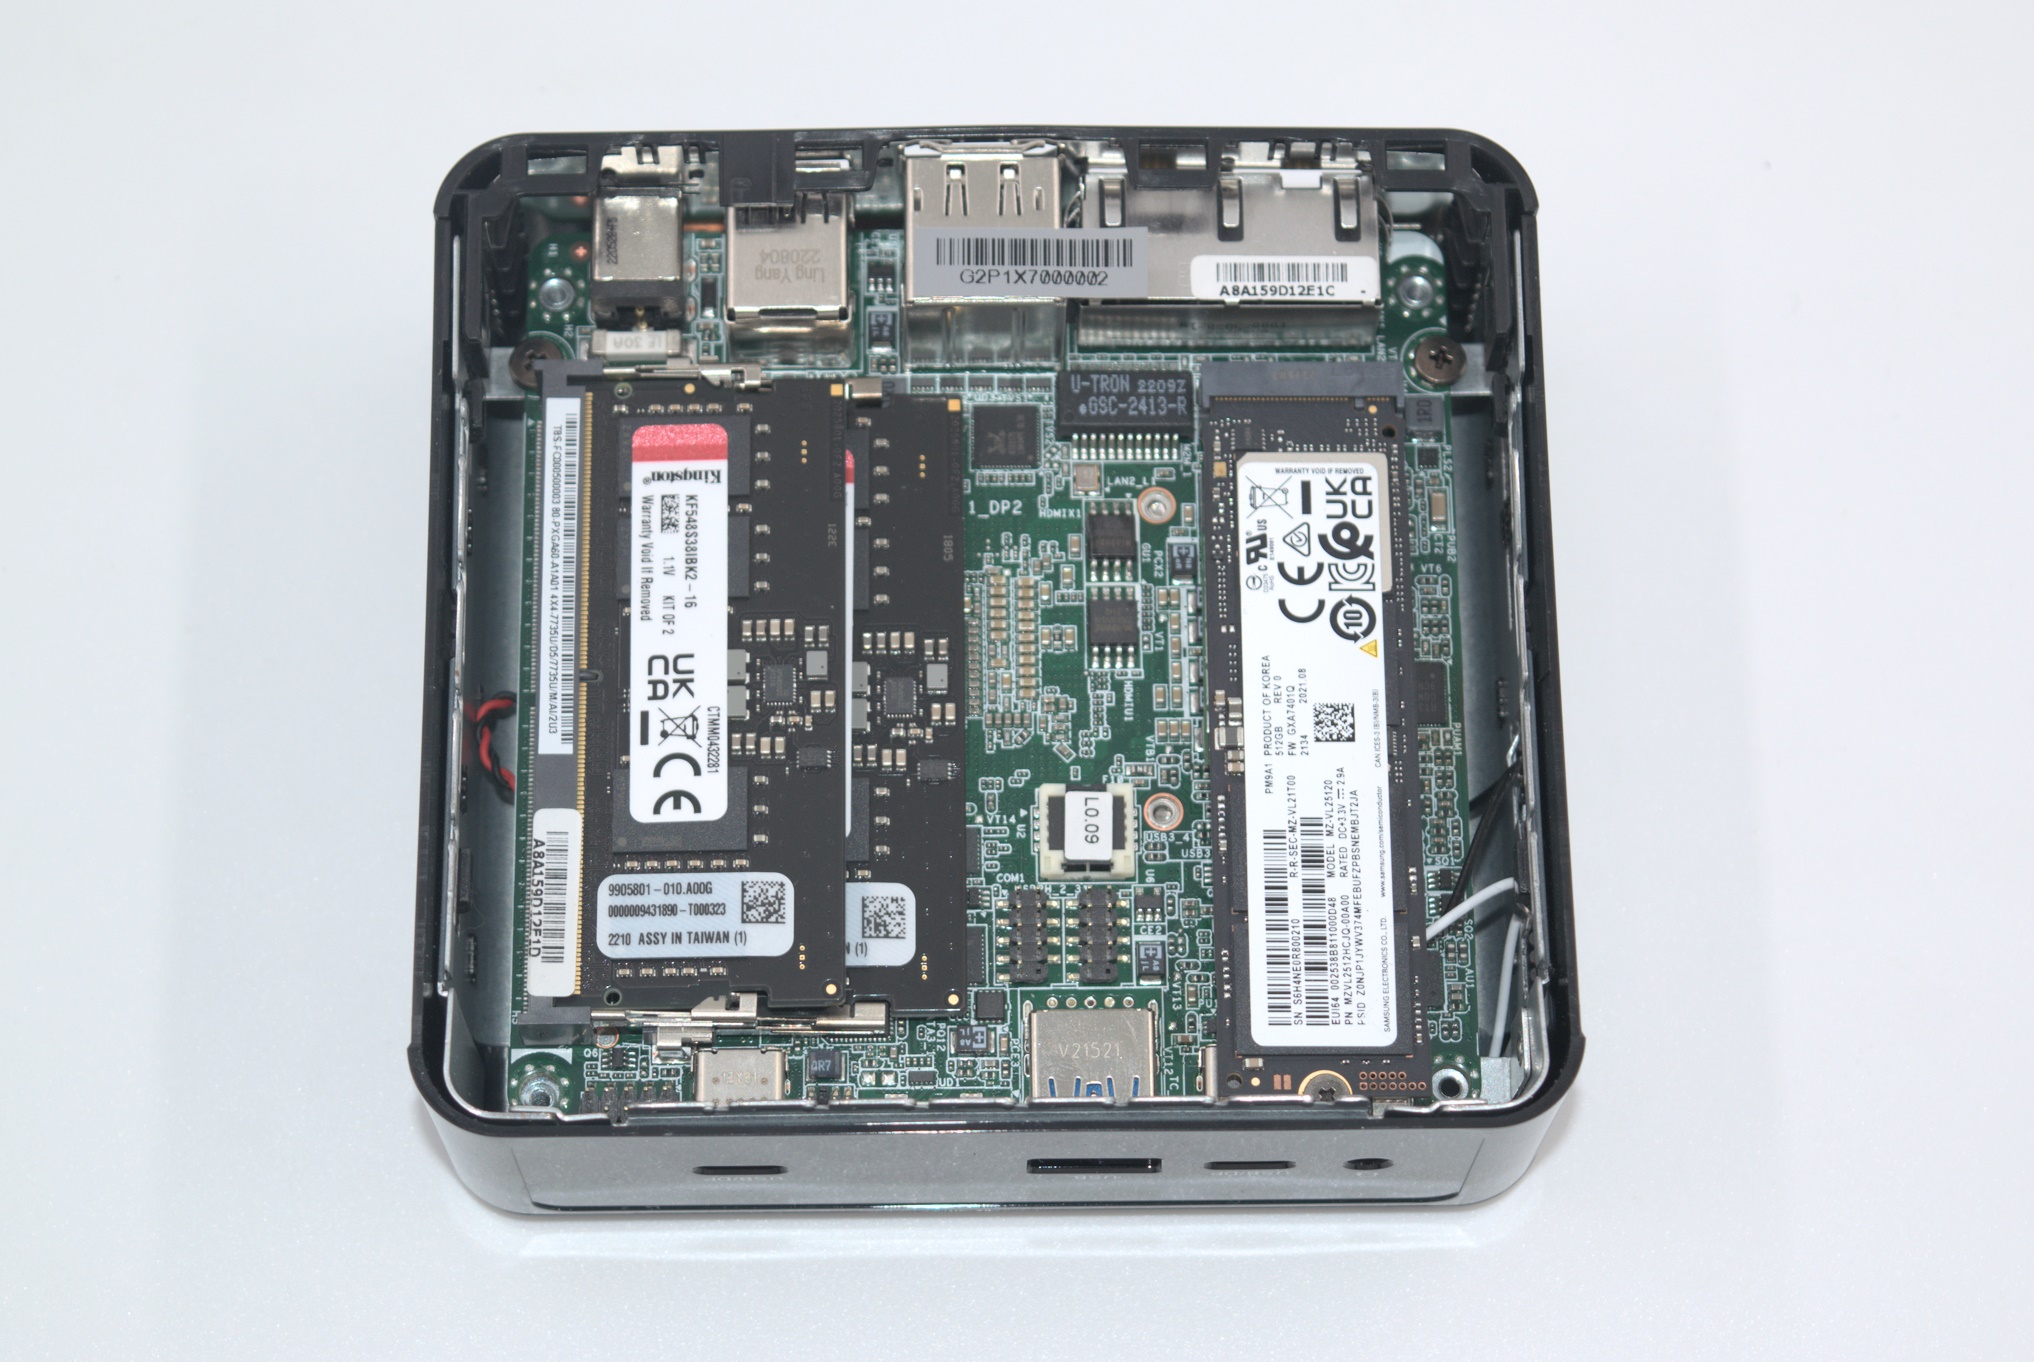
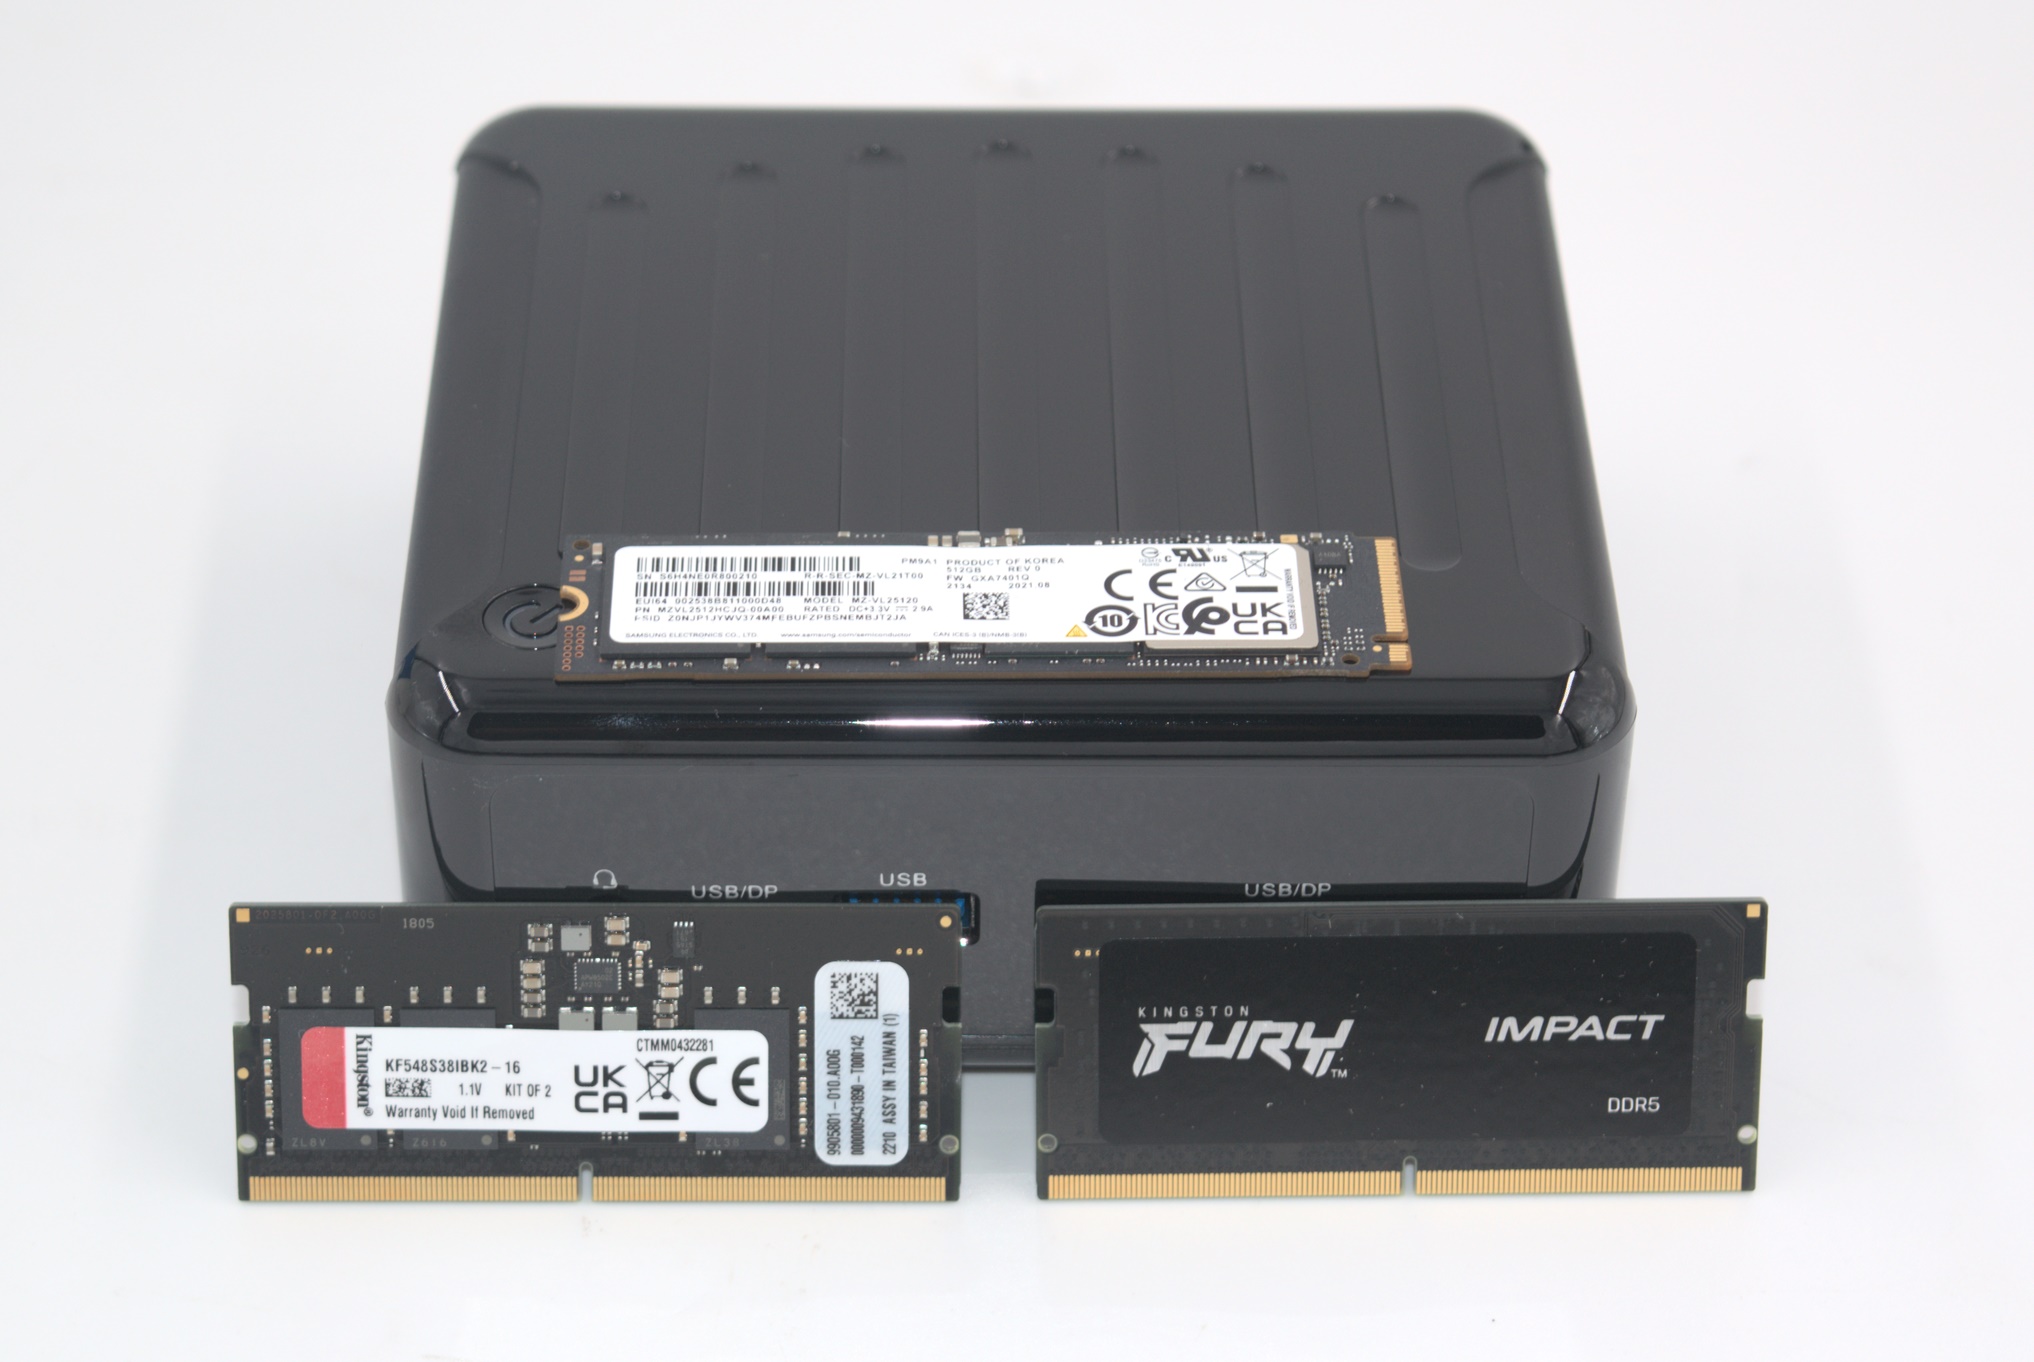
The barebones version needs to DDR5 SODIMMs and a M.2 2280 SSD to complete the build. Kingston offered a DDR5-4800 FURY kit (2x8GB) for the build, and we complemented that with a Samsung PM9A1 512GB Gen 4 NVMe SSD (OEM version of the 980 PRO).
Access to the SODIMM and M.2 slots is via the underside. Removal of the four screws at the bottom allows the panel to be popped off.
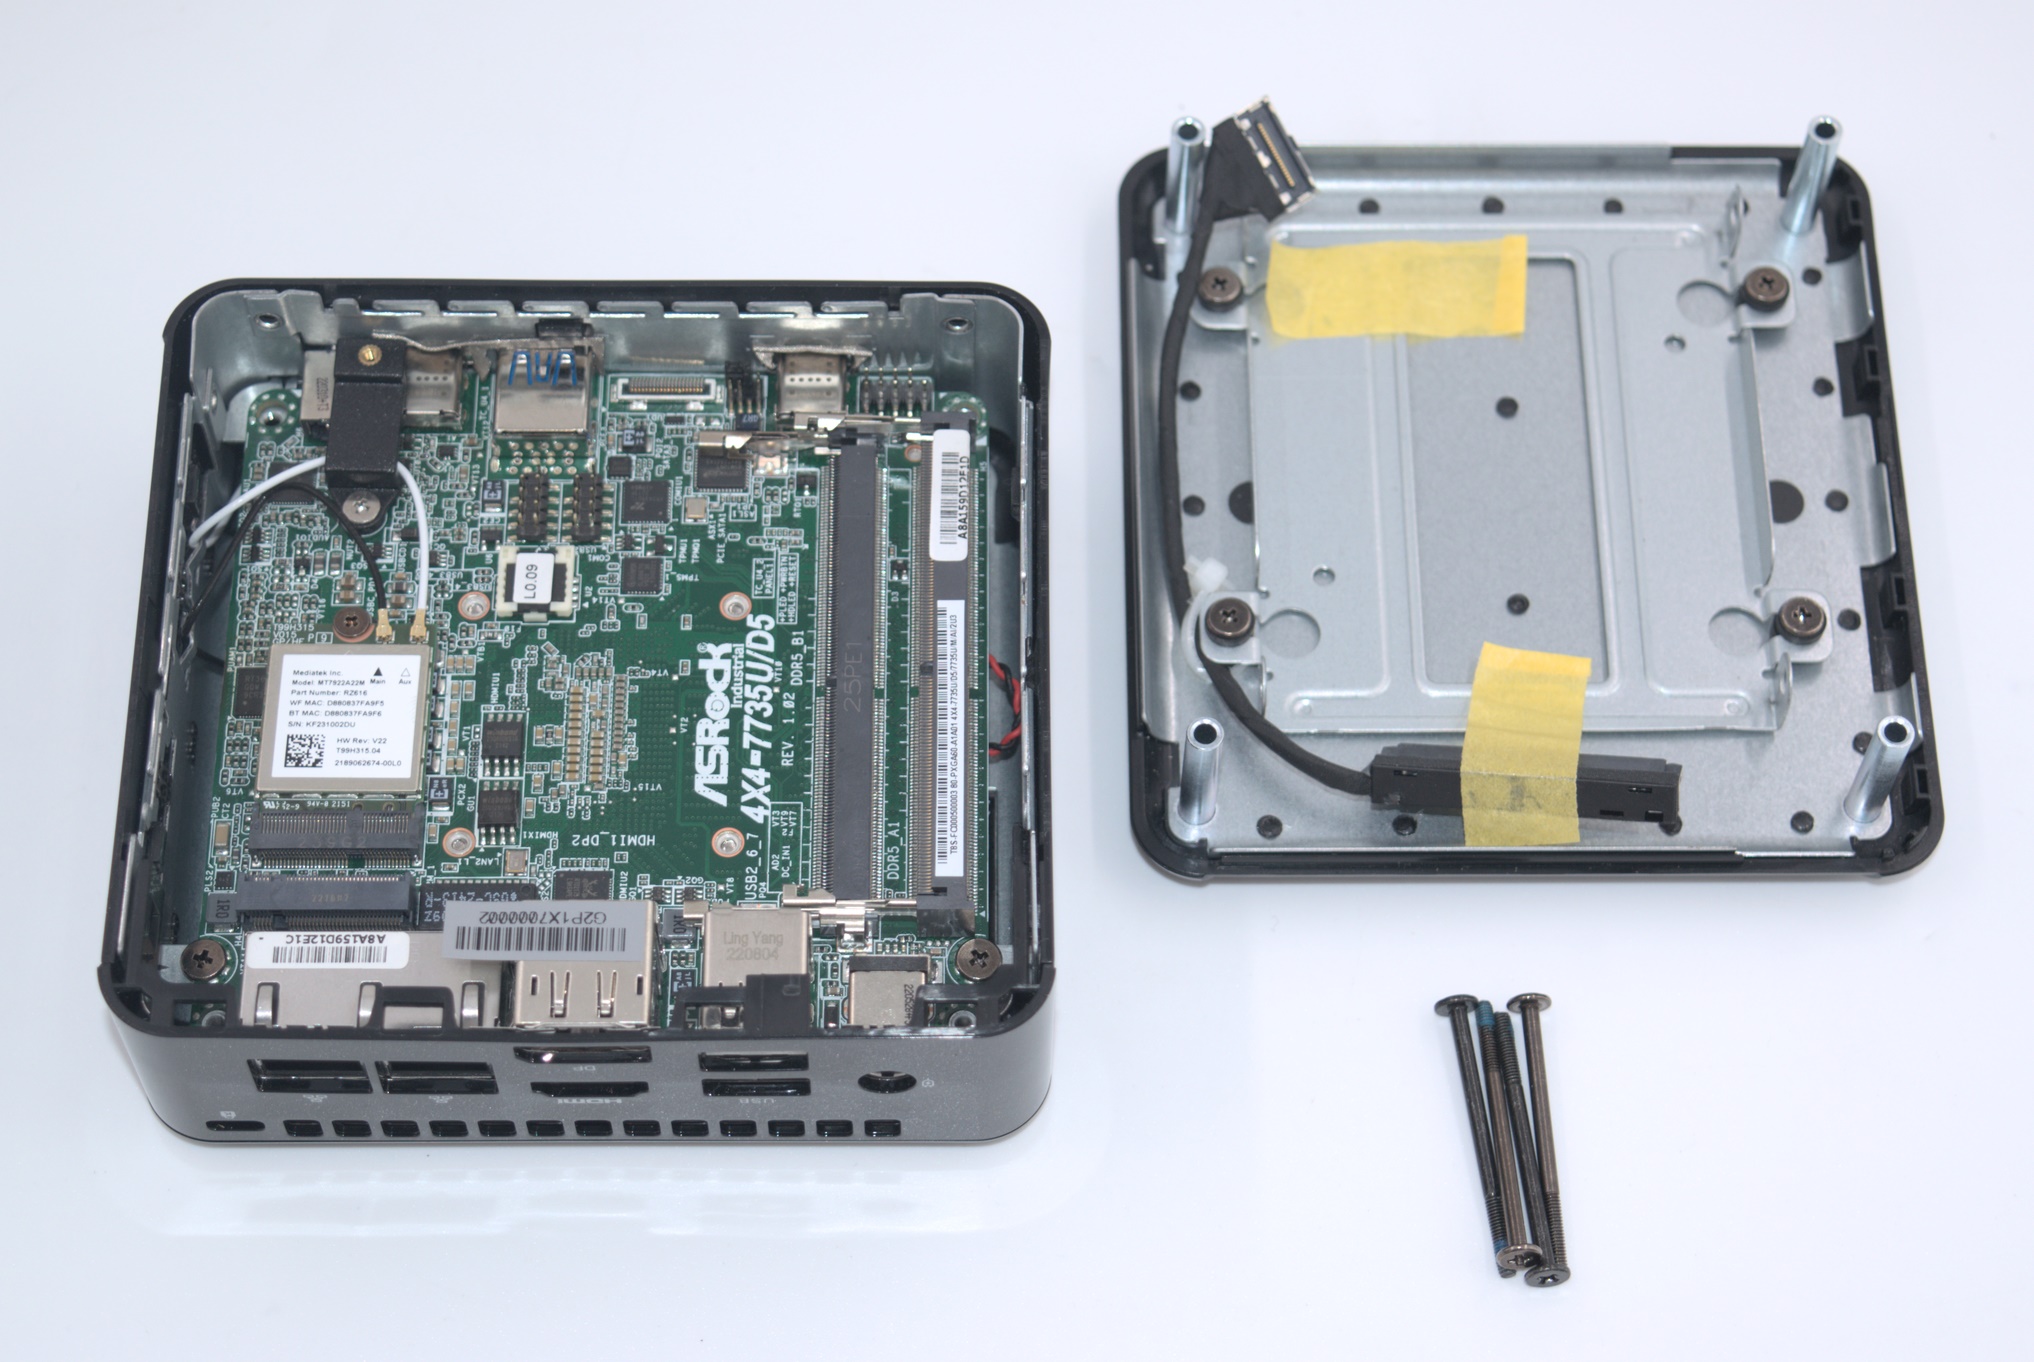
While it is possible to install a 2.5" SATA drive in the system, ASRock Industrial strongly recommends not doing it in order to aid with proper airflow. The installation process is otherwise similar to the older 4X4 BOX systems, and we were up and running with a freshly installed OS in no time. Windows online updates resolve almost all of the unknown devices in the device manager, but a few do need the AMD Chipset Driver package from ASRock Industrial's product support page.
The full specifications of the review sample (as tested) are summarized in the table below. As we will note in the next section, the BIOS allows the system to be configured in either of two modes with different TDPs, as specified in the Processor entry.
| Systems Specifications (as tested) |
||
| ASRock 4X4 BOX-7735U (Performance) | ASRock 4X4 BOX-7735U (Normal) | |
| Processor | AMD Ryzen 7 7735U Zen 3+ (Rembrandt R) 8C/16T, 2.7 - 4.75 GHz TSMC 6nm, 16MB L3, 28W Max / Target TDP : 50W / 42W |
AMD Ryzen 7 7735U Zen 3+ (Rembrandt R) 8C/16T, 2.7 - 4.75 GHz TSMC 6nm, 16MB L3, 28W Max / Target TDP : 34W / 28W |
| Memory | Kingston Fury KF548S38-8 DDR5-4800 SODIMM 38-38-38-70 @ 4800 MHz 2x8 GB |
Kingston Fury KF548S38-8 DDR5-4800 SODIMM 38-38-38-70 @ 4800 MHz 2x8 GB |
| Graphics | AMD Radeon 680M (Rembrandt) - Integrated (12 CUs @ 2.2 GHz) |
AMD Radeon 680M (Rembrandt) - Integrated (12 CUs @ 2.2 GHz) |
| Disk Drive(s) | Samsung PM9A1 MZVL2512HCJQ (512 GB; M.2 2280 PCIe 4.0 x4 NVMe;) (Samsung 6th Gen. V-NAND 128L (136T) 3D TLC; Samsung Elpis S4LV003 Controller; OEM version of 980 PRO) |
Samsung PM9A1 MZVL2512HCJQ (512 GB; M.2 2280 PCIe 4.0 x4 NVMe;) (Samsung 6th Gen. V-NAND 128L (136T) 3D TLC; Samsung Elpis S4LV003 Controller; OEM version of 980 PRO) |
| Networking | 1x 2.5 GbE RJ-45 (Realtek RTL8125) 1x GbE RJ-45 (Realtek RTL8111EPV) Mediatek MT7922 (RZ616) Wi-Fi 6E (2x2 802.11ax - 1.9 Gbps) |
1x 2.5 GbE RJ-45 (Realtek RTL8125) 1x GbE RJ-45 (Realtek RTL8111EPV) Mediatek MT7922 (RZ616) Wi-Fi 6E (2x2 802.11ax - 1.9 Gbps) |
| Audio | Realtek ALC233 (3.5mm Audio Jack in Front) Digital Audio with Bitstreaming Support over HDMI and Display Port |
Realtek ALC233 (3.5mm Audio Jack in Front) Digital Audio with Bitstreaming Support over HDMI and Display Port |
| Video | 1x HDMI 2.1 1x Display Port 1.4a 2x Display Port 1.4a over USB4 Type-C |
1x HDMI 2.1 1x Display Port 1.4a 2x Display Port 1.4a over USB4 Type-C |
| Miscellaneous I/O Ports | 2x USB 2.0 (Rear) 2x USB4 Type-C (Front) 1x USB 3.2 Gen 2 Type-A (Front) |
2x USB 2.0 (Rear) 2x USB4 Type-C (Front) 1x USB 3.2 Gen 2 Type-A (Front) |
| Operating System | Windows 11 Enterprise (22000.1696) | Windows 11 Enterprise (22000.1696) |
| Pricing | (Street Pricing on April 17th, 2023) US $630 (barebones) USD 781 (as configured, no OS) |
(Street Pricing on April 17th, 2023) US $630 (barebones) USD 781 (as configured, no OS) |
| Full Specifications | ASRock Industrial 4X4 BOX-7735U/D5 Specifications | ASRock Industrial 4X4 BOX-7735U/D5 Specifications |
In the next section, we take a look at the various BIOS options and follow it up with a detailed platform analysis.
Setup Notes and Platform Analysis
The video below presents the entire gamut of available options in the BIOS of the 4X4 BOX-7735U/D5. Of particular interest is the 'CPU Operating Mode' under 'Advanced > CPU Configuration'. It is set to 'Normal' by default, corresponding to a TDP of 28W. Altering it to 'Performance' sets the fan speed to maximum irrespective of the actual load, but ekes out extra performance by pushing up the TDP to 42W.
The system is equipped with dual LAN ports backed up by Realtek controllers. Similar to previous 4X4 BOX systems, the 1GbE link comes with DASH support to make it easy for IT departments to deploy and manage the system with an out-of-band management interface. This support is disabled by default.
The block diagram below presents the overall high-speed I/O distribution.
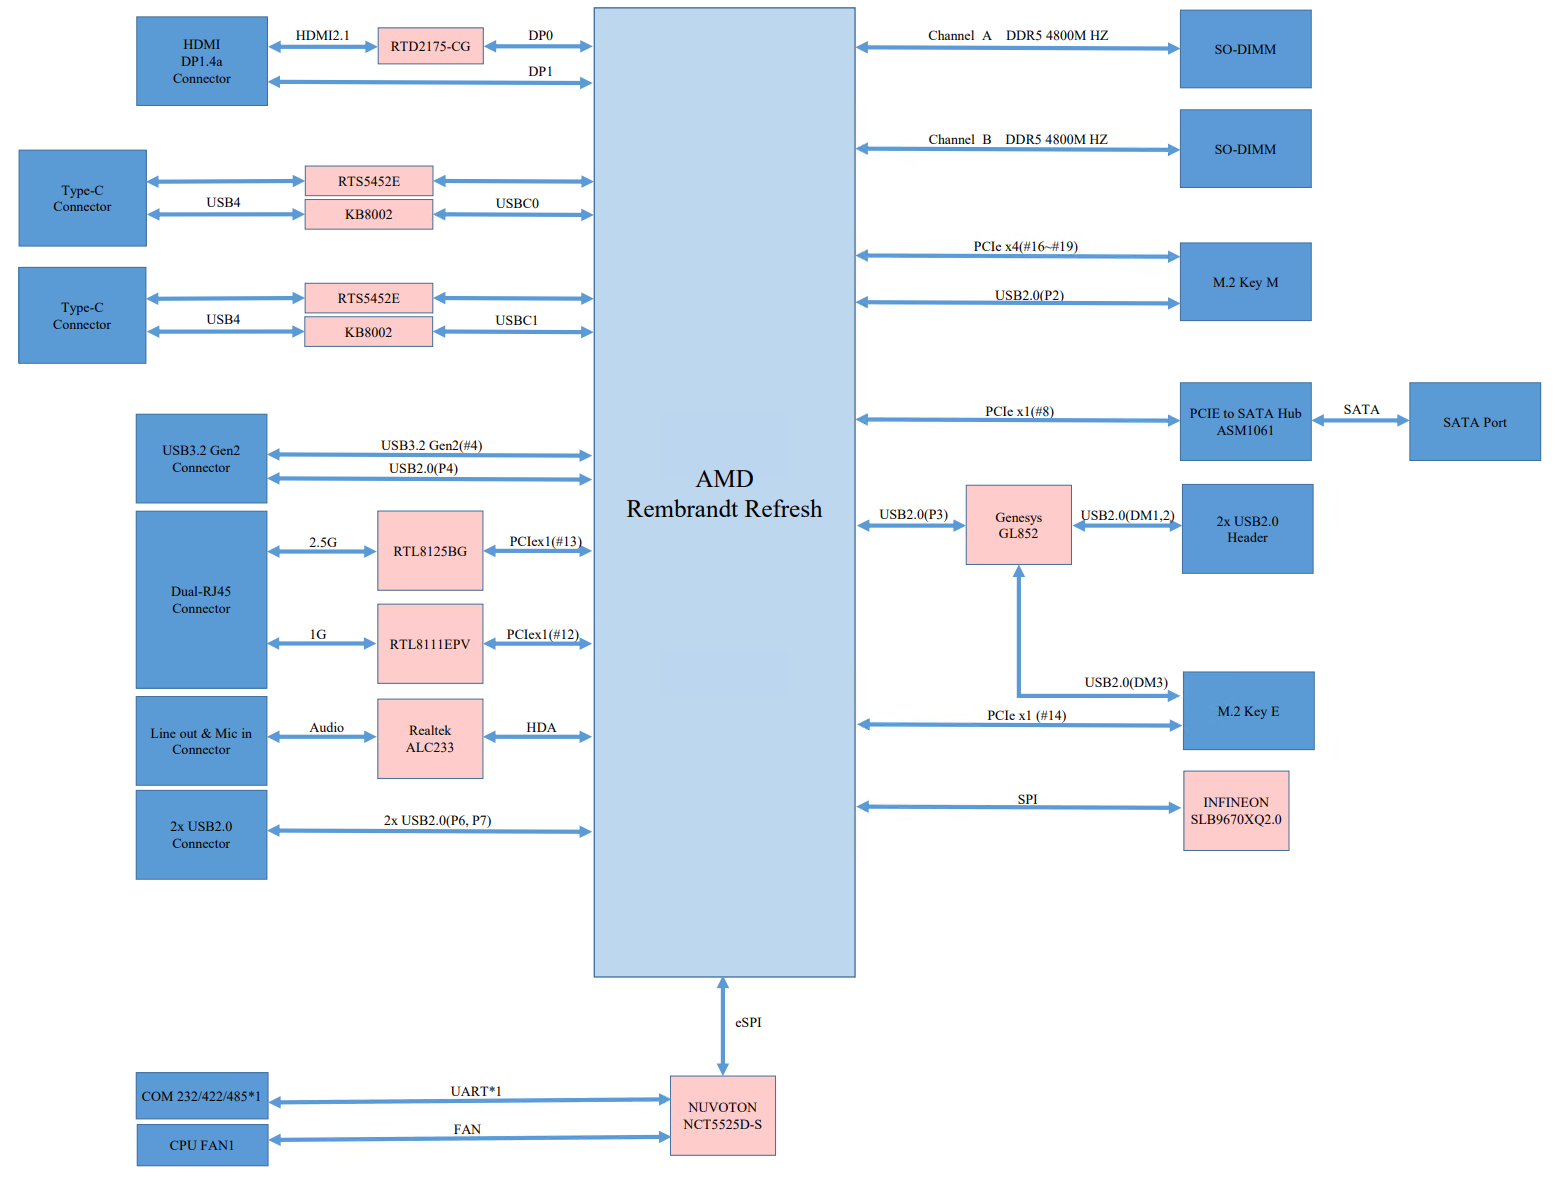
The HDMI 2.1 port is actually driven from one of the DisplayPort outputs of the SoC with a Realtek RTD2175 protocol convertor on the board. The two Type-C ports in the front panel are both USB4 driven from the SoC in the same manner - a Realtek RTS5452E power delivery controller and a Kandou Technologies KB8002 retimer. One of the unfortunate aspects here is that this retimer doesn't support USB 3.2 Gen 2x2 (20 Gbps) operation, but all other interesting modes including full PCIe tunneling are supported. The rest of the platform components (including the network controllers, audio codec, etc.) are similar to the one in the previous 4X4 BOX series.
In today's review, we compare the 4X4 BOX-7735U/D5 and a host of other UCFF systems based on processors with TDPs ranging from 15W to 40W.
| Comparative PC Configurations | ||
| Aspect | ASRock 4X4 BOX-7735U (Performance) | |
| CPU | AMD Ryzen 7 7735U Zen 3+ (Rembrandt R) 8C/16T, 2.7 - 4.75 GHz TSMC 6nm, 16MB L3, 28W Max / Target TDP : 50W / 42W |
AMD Ryzen 7 7735U Zen 3+ (Rembrandt R) 8C/16T, 2.7 - 4.75 GHz TSMC 6nm, 16MB L3, 28W Max / Target TDP : 50W / 42W |
| GPU | AMD Radeon 680M (Rembrandt) - Integrated (12 CUs @ 2.2 GHz) |
AMD Radeon 680M (Rembrandt) - Integrated (12 CUs @ 2.2 GHz) |
| RAM | Kingston Fury KF548S38-8 DDR5-4800 SODIMM 38-38-38-70 @ 4800 MHz 2x8 GB |
Kingston Fury KF548S38-8 DDR5-4800 SODIMM 38-38-38-70 @ 4800 MHz 2x8 GB |
| Storage | Samsung PM9A1 MZVL2512HCJQ (512 GB; M.2 2280 PCIe 4.0 x4 NVMe;) (Samsung 6th Gen. V-NAND 128L (136T) 3D TLC; Samsung Elpis S4LV003 Controller; OEM version of 980 PRO) |
Samsung PM9A1 MZVL2512HCJQ (512 GB; M.2 2280 PCIe 4.0 x4 NVMe;) (Samsung 6th Gen. V-NAND 128L (136T) 3D TLC; Samsung Elpis S4LV003 Controller; OEM version of 980 PRO) |
| Wi-Fi | 1x 2.5 GbE RJ-45 (Realtek RTL8125) 1x GbE RJ-45 (Realtek RTL8111EPV) Mediatek MT7922 (RZ616) Wi-Fi 6E (2x2 802.11ax - 1.9 Gbps) |
1x 2.5 GbE RJ-45 (Realtek RTL8125) 1x GbE RJ-45 (Realtek RTL8111EPV) Mediatek MT7922 (RZ616) Wi-Fi 6E (2x2 802.11ax - 1.9 Gbps) |
| Price (in USD, when built) | (Street Pricing on April 17th, 2023) US $630 (barebones) USD 781 (as configured, no OS) |
(Street Pricing on April 17th, 2023) US $630 (barebones) USD 781 (as configured, no OS) |
The next few sections will deal with comparative benchmarks for the above systems.
System Performance: UL and BAPCo Benchmarks
Our 2022 Q4 update to the test suite for Windows 11-based systems carries over some of the standard benchmarks we have been using over the last several years, including UL's PCMark and BAPCo's SYSmark. New additions include BAPCo's CrossMark multi-platform benchmarking tool, as well as UL's Procyon benchmark suite.
UL PCMark 10
UL's PCMark 10 evaluates computing systems for various usage scenarios (generic / essential tasks such as web browsing and starting up applications, productivity tasks such as editing spreadsheets and documents, gaming, and digital content creation). We benchmarked select PCs with the PCMark 10 Extended profile and recorded the scores for various scenarios. These scores are heavily influenced by the CPU and GPU in the system, though the RAM and storage device also play a part. The power plan was set to Balanced for all the PCs while processing the PCMark 10 benchmark. The scores for each contributing component / use-case environment are also graphed below.
| UL PCMark 10 - Performance Scores | |||
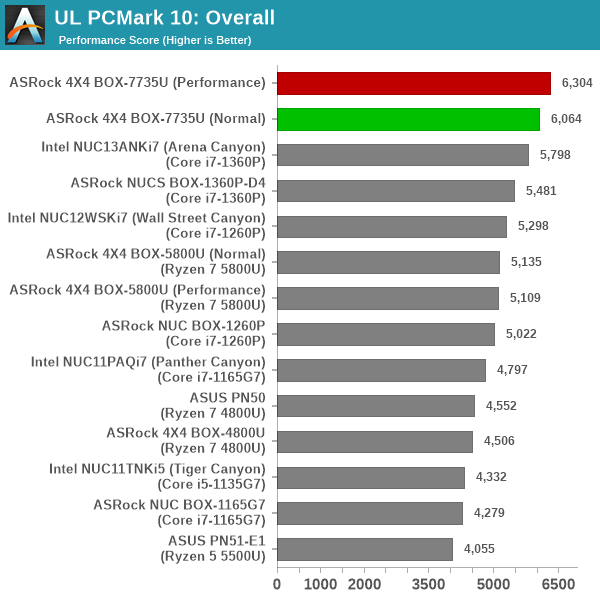
The overall scores tend to favor the 4X4 BOX-7735U/D5 configurations because of their significant edge in the gaming component. In the Essentials category, the RPL-P units have a good lead, while the other two categories show the order changing based on the available power budget for the processors.
UL Procyon v2.1.544
PCMark 10 utilizes open-source software such as Libre Office and GIMP to evaluate system performance. However, many of their professional benchmark customers have been requesting evaluation with commonly-used commercial software such as Microsoft Office and Adobe applications. In order to serve their needs, UL introduced the Procyon benchmark in late 2020. There are five benchmark categories currently - Office Productivity, AI Inference, Battery Life, Photo Editing, and Video Editing. AI Inference benchmarks are available only for Android devices, while the battery life benchmark is applicable to Windows devices such as notebooks and tablets. We presents results from our processing of the other three benchmarks.
| UL Procyon - Office Productivity Scores | |||
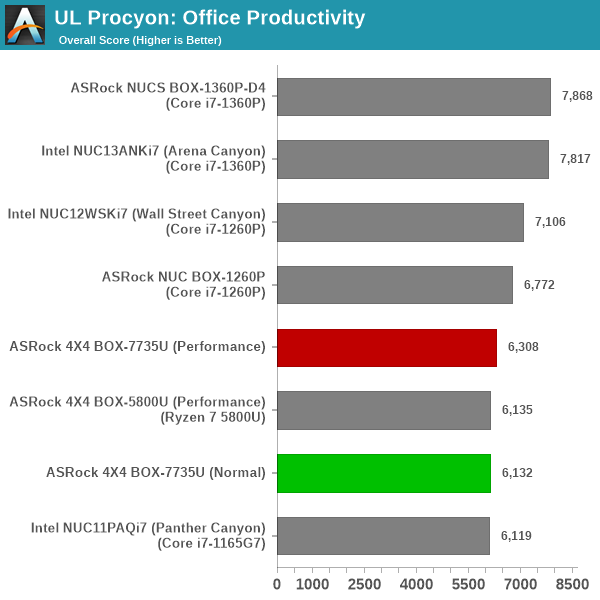
The Office workloads tend to favor the systems with the heterogeneous processors. Both ADL-P and RPL-P have the edge over the Rembrandt-R configurations across all components. It is likely that raw core count helps more than just multiple threads.
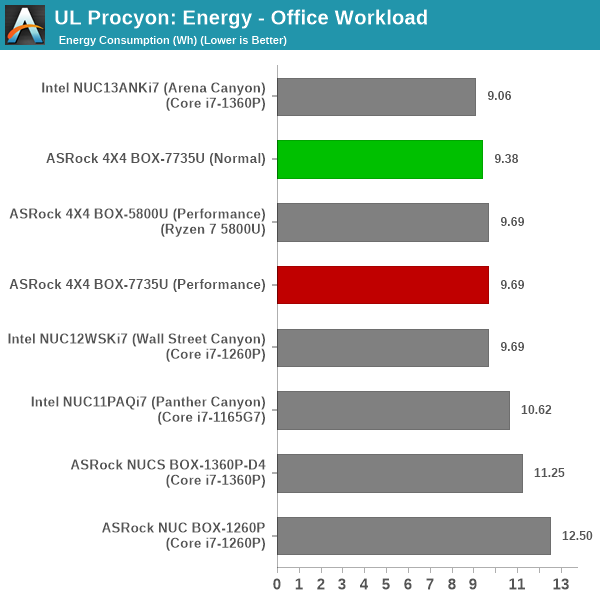
Energy numbers for Rembrandt-R are better than ADL-P, but RPL-P manages to eke out a slender lead.
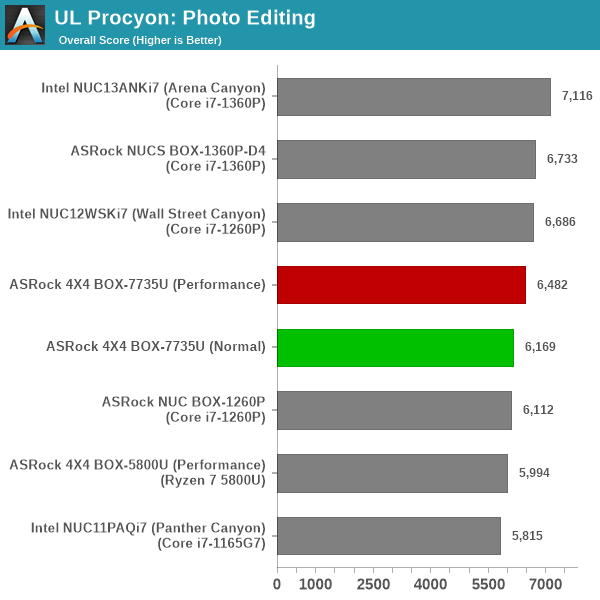
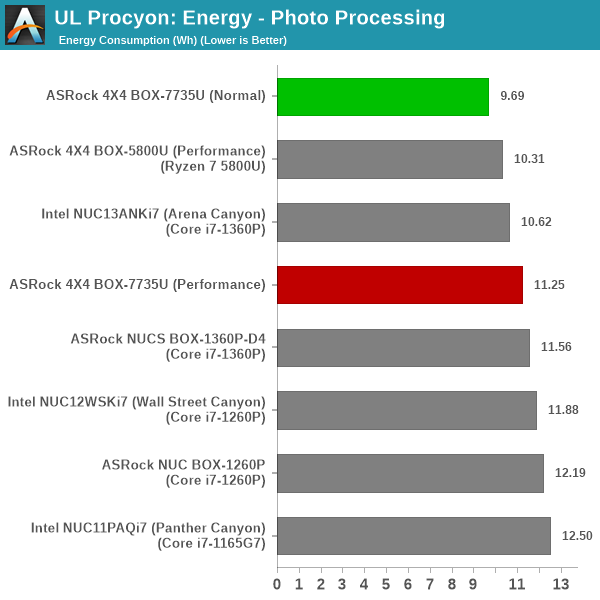
Moving on to the evaluation of Adobe Photoshop and Adobe Lightroom, we find that the heterogeneous processors with larger raw core counts have the edge. However, the 28W Rembrandt-R configuration delivers the best energy efficiency.
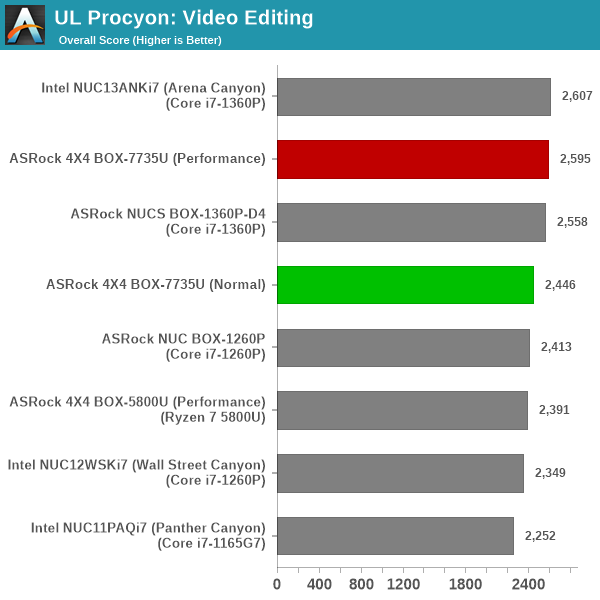
UL Procyon evaluates performance for video editing using Adobe Premier Pro. This is most a measure of the iGPU prowess, and the 42W Rembrandt-R almost matches the performance delivered by the 40W Raptor Lake-P system.
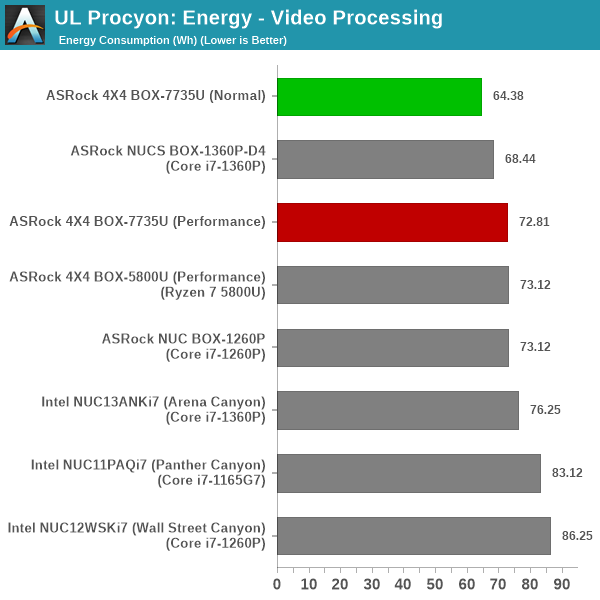
On the energy front, the 28W Rembrandt-R configuration is again the most effective - consuming the least amount over the entire duration needed to complete the tasks.
BAPCo CrossMark 1.0.1.86
BAPCo's CrossMark aims to simplify benchmark processing while still delivering scores that roughly tally with SYSmark. The main advantage is the cross-platform nature of the tool - allowing it to be run on smartphones and tablets as well.
| BAPCo CrossMark 1.0.1.86 - Sub-Category Scores | |||
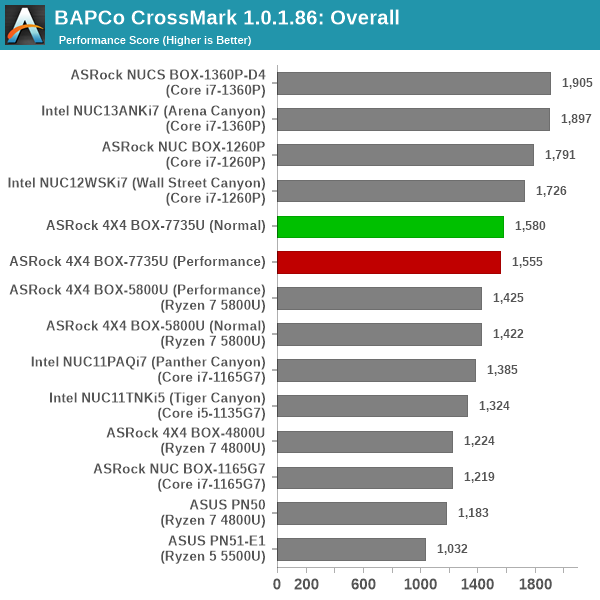
The relative performance seen in UL Procyon translate to CrossMark also, as expected. Without gaming workloads in the mix, the Rembrandt-R configurations fall behind the heterogeneous processor-based systems. However, there is a good jump in performance over the Cezanne system.
System Performance: Miscellaneous Workloads
Standardized benchmarks such as UL's PCMark 10 and BAPCo's SYSmark take a holistic view of the system and process a wide range of workloads to arrive at a single score. Some systems are required to excel at specific tasks - so it is often helpful to see how a computer performs in specific scenarios such as rendering, transcoding, JavaScript execution (web browsing), etc. This section presents focused benchmark numbers for specific application scenarios.
3D Rendering - CINEBENCH R23
We use CINEBENCH R23 for 3D rendering evaluation. R23 provides two benchmark modes - single threaded and multi-threaded. Evaluation of different PC configurations in both supported modes provided us the following results. Similar to one of the PCMark 10 workload components, we see single-threaded performance for the 28W configuration being better than the 42W configuration. However, things return to normal in the mult-threaded case.
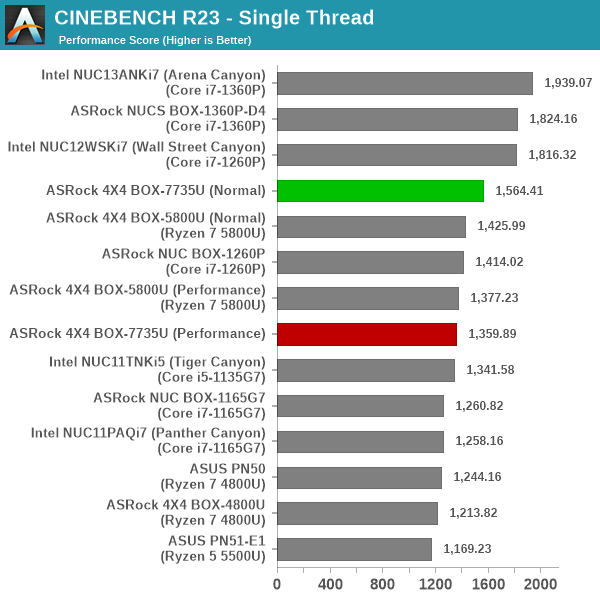
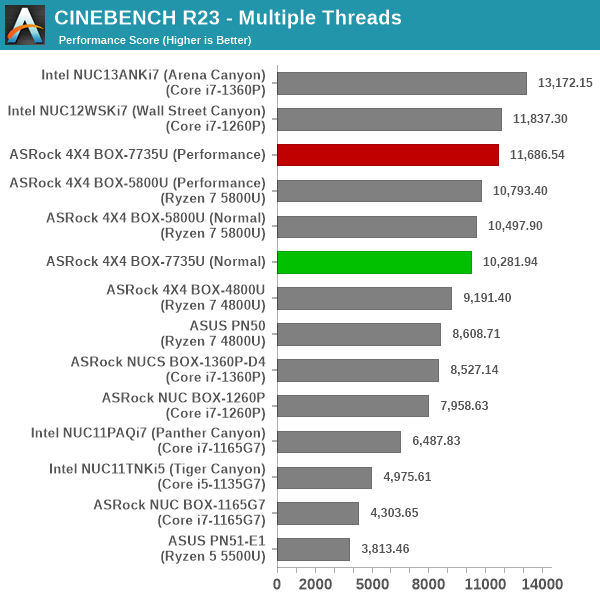
With both ADL-P and RPL-P matching on thread counts (and actually having more, albeit weaker, cores), both ST and MT performance of Rembrandt-R is weak on a comparative basis. However, it is still a solid step up from Cezanne.
Transcoding: Handbrake 1.5.1
Handbrake is one of the most user-friendly open source transcoding front-ends in the market. It allows users to opt for either software-based higher quality processing or hardware-based fast processing in their transcoding jobs. Our new test suite uses the 'Tears of Steel' 4K AVC video as input and transcodes it with a quality setting of 19 to create a 720p AVC stream and a 1080p HEVC stream.
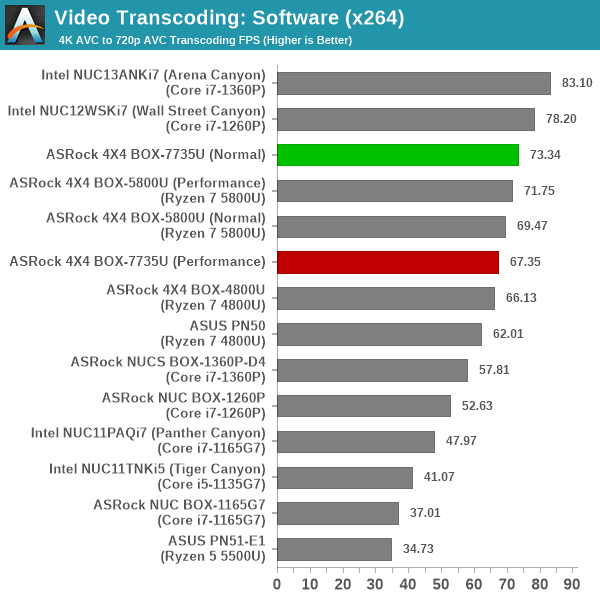
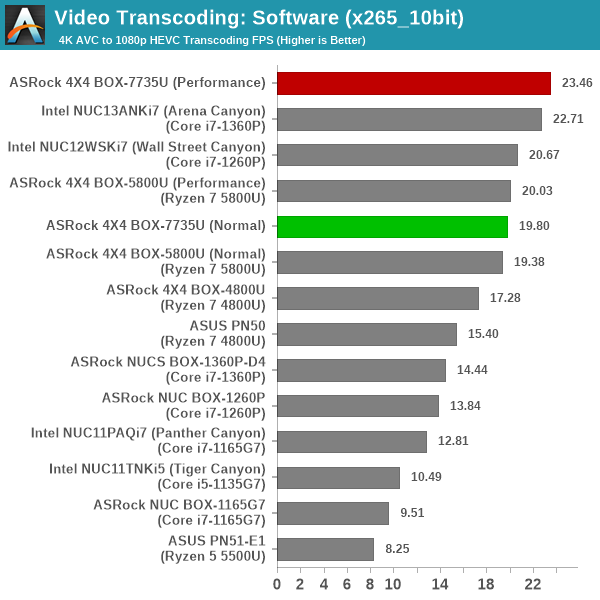
The features used in the x264 workload are more amenable to the heterogeneous processors. However, for x265, we see that a larger number of high-performance cores will outperform the rest when provided similar power envelopes.
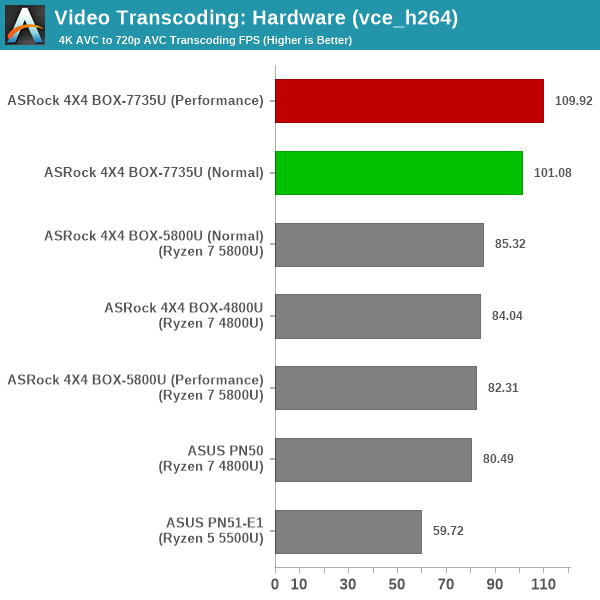
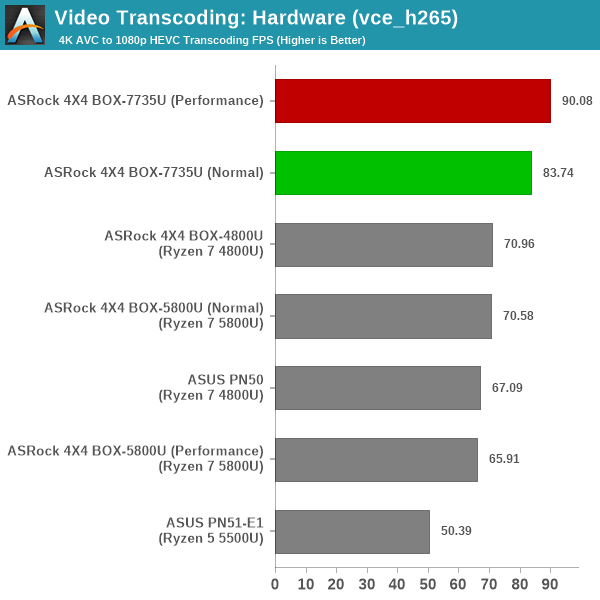
It does not make sense to compare VCE and QSV encoding performance, as the quality of the resultant files are completely different. So, we only look at VCE results here. The VCN engine is clocked at 1.44 GHz - much higher than the previous generation - allowing it to deliver 15%+ performance at similar power envelopes as Cezanne.
Archiving: 7-Zip 21.7
The 7-Zip benchmark is carried over from our previous test suite with an update to the latest version of the open source compression / decompression software.
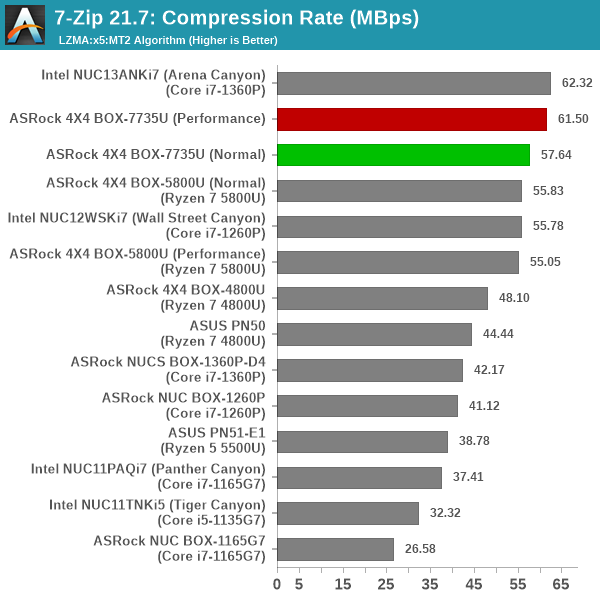
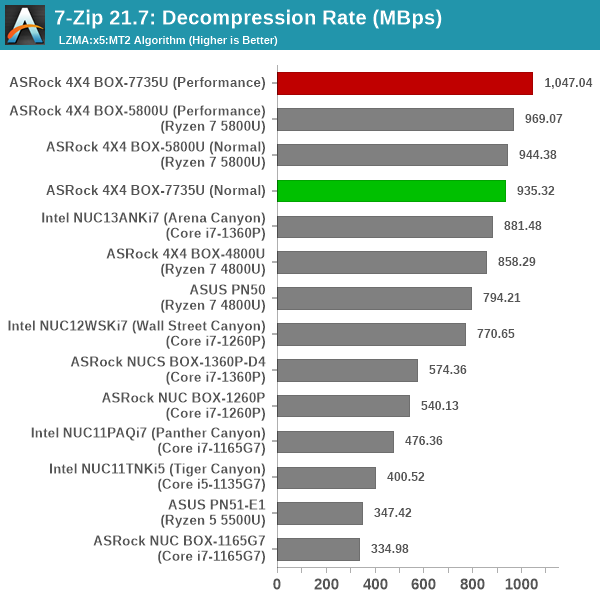
Larger number of high-performance cores helps the Rembrandt-R system gain an edge in the decompression case. However, the competition is much more fierce in the other direction, with both the Arena Canyon NUC and the 4X4 BOX-7735U/D5 delivering similar compression rates at the 40W TDP point.
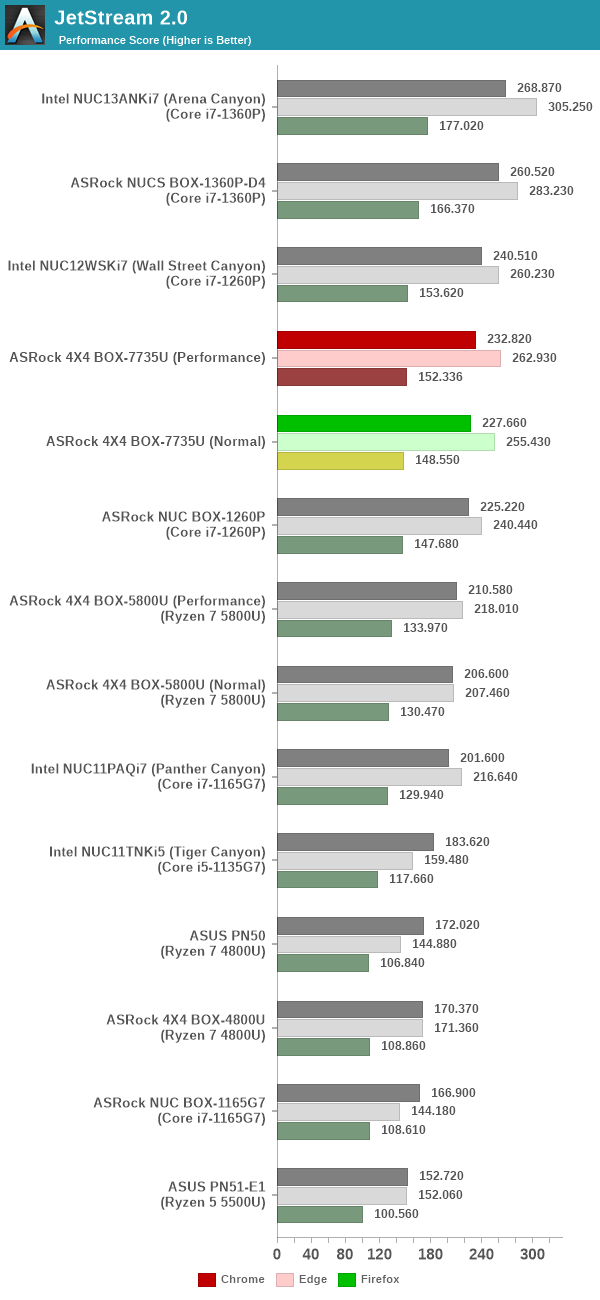
Web Browsing: JetStream, Speedometer, and Principled Technologies WebXPRT4
Web browser-based workloads have emerged as a major component of the typical home and business PC usage scenarios. For headless systems, many applications based on JavaScript are becoming relevant too. In order to evaluate systems for their JavaScript execution efficiency, we are carrying over the browser-focused benchmarks from the WebKit developers used in our notebook reviews. Hosted at BrowserBench, JetStream 2.0 benchmarks JavaScript and WebAssembly performance, while Speedometer measures web application responsiveness.
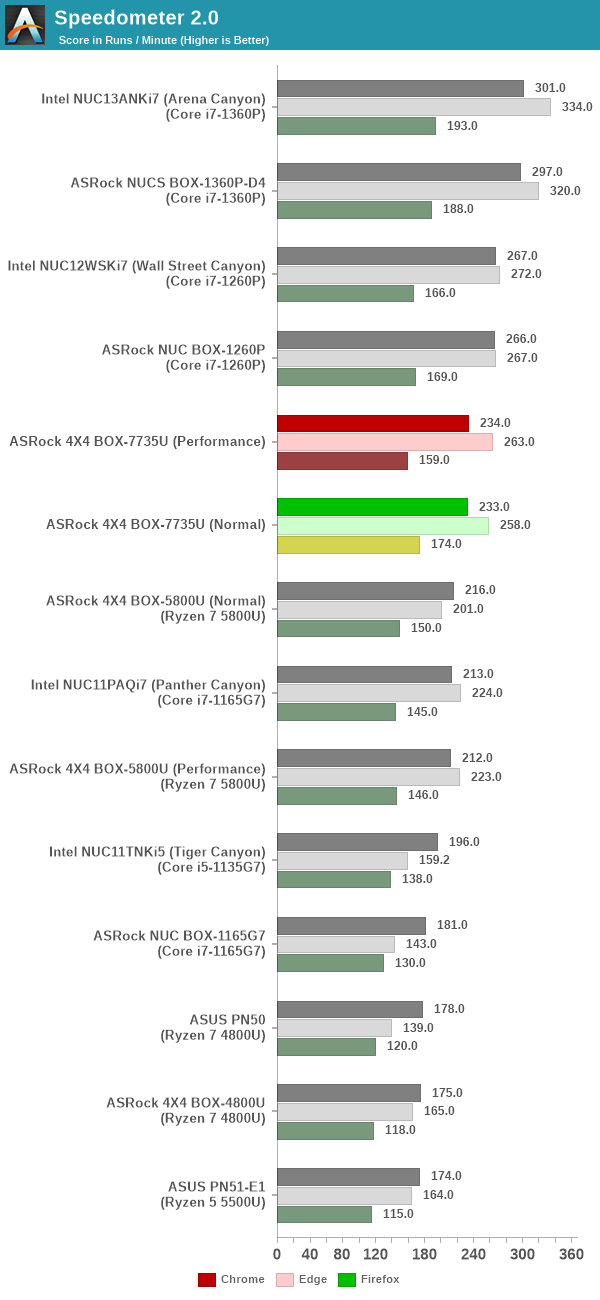
From a real-life workload perspective, we also process WebXPRT4 from Principled Technologies. WebXPRT4 benchmarks the performance of some popular JavaScript libraries that are widely used in websites.
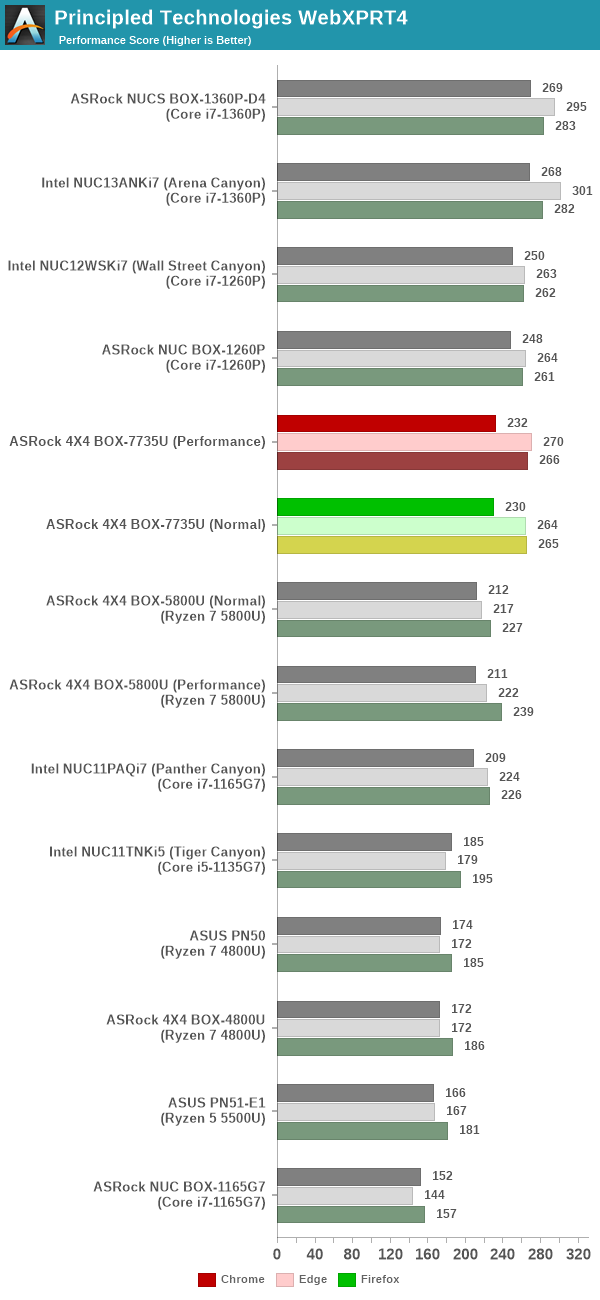
Across all web browsing tests, the systems equipped with heterogeneous processors appear in the top half. However, the Rembrandt-R configurations are right behind them (and would have been on top without ADL-P and RPL-P in the picture).
Application Startup: GIMP 2.10.30
A new addition to our systems test suite is AppTimer - a benchmark that loads up a program and determines how long it takes for it to accept user inputs. We use GIMP 2.10.30 with a 50MB multi-layered xcf file as input. What we test here is the first run as well as the cached run - normally on the first time a user loads the GIMP package from a fresh install, the system has to configure a few dozen files that remain optimized on subsequent opening. For our test we delete those configured optimized files in order to force a fresh load every second time the software is run.
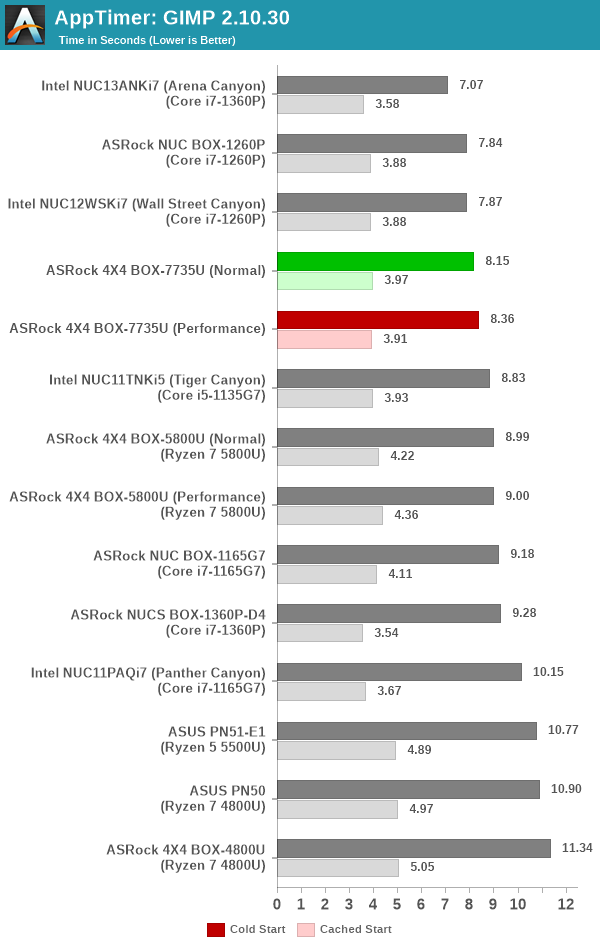
As it turns out, GIMP does optimizations for every CPU thread in the system, which requires that higher thread-count processors take a lot longer to run. So the test runs quick on systems with fewer threads, however fast cores are also needed. The end result is that heterogeneous systems with non-threaded E cores have a slight advantage over the rest of the pack.
Cryptography Benchmarks
Cryptography has become an indispensable part of our interaction with computing systems. Almost all modern systems have some sort of hardware-acceleration for making cryptographic operations faster and more power efficient. In the case of IoT servers, many applications - including web server functionality and VPN - need cryptography acceleration.
BitLocker is a Windows features that encrypts entire disk volumes. While drives that offer encryption capabilities are dealt with using that feature, most legacy systems and external drives have to use the host system implementation. Windows has no direct benchmark for BitLocker. However, we cooked up a BitLocker operation sequence to determine the adeptness of the system at handling BitLocker operations. We start off with a 4.5GB RAM drive in which a 4GB VHD (virtual hard disk) is created. This VHD is then mounted, and BitLocker is enabled on the volume. Once the BitLocker encryption process gets done, BitLocker is disabled. This triggers a decryption process. The times taken to complete the encryption and decryption are recorded. This process is repeated 25 times, and the average of the last 20 iterations is graphed below.
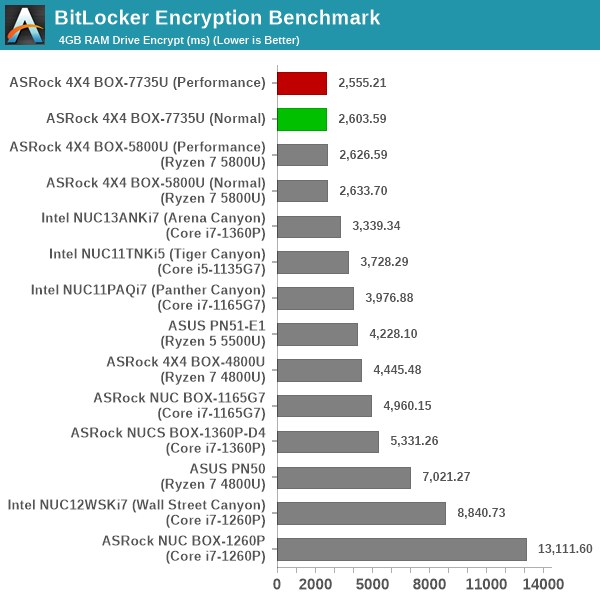
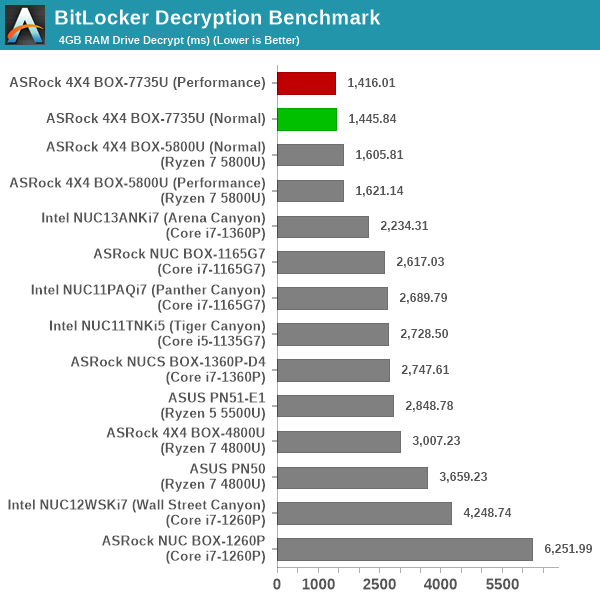
Hardware acceleration is available for the operations in all of the systems. The time taken for processing is directly dependent on the available power budget within each vendor (Intel or AMD). AMD has historically held the edge in these types of workloads, and that continues with Rembrandt-R.
GPU Performance: Synthetic Benchmarks
AMD's Rembrandt-R includes an integrated GPU update to enable it to compete against Intel's Xe iGPUs. The new RDNA2 microarchitecture is present in the Ryzen 7 7735U in the form of the Radeon 680M. With 12 CUs and 768 shader units clocked at 2.2 GHz, AMD claims that the GPU should be capable of playing virtually any modern game at Full HD resolutions. For full-blown desktop systems or mini-PCs targeting the gaming market, we look at gaming workloads. However, for UCFF models like the 4X4 BOX-7735U, we restrict ourselves to a series of canned benchmarks from Kishonti and Futuremark / UL. Prior to that, a look at the capabilities of the GPU via GPU-Z is warranted.
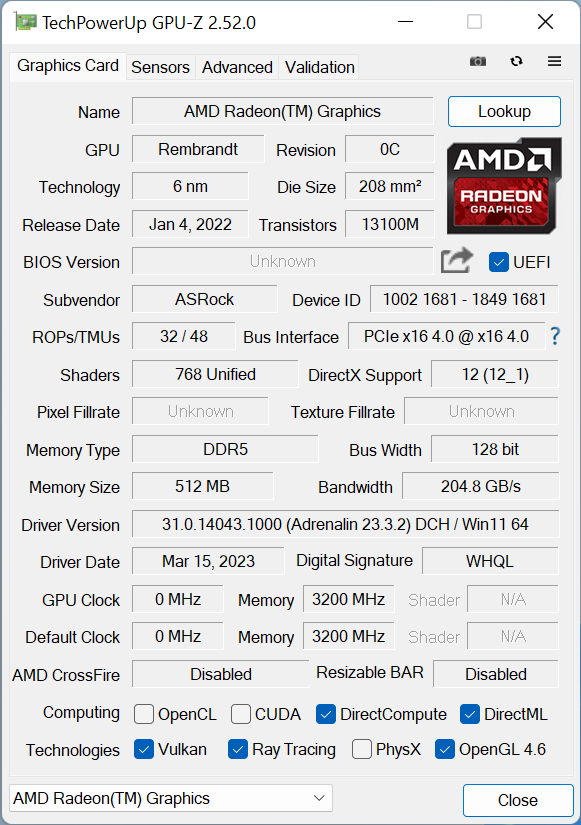
While AMD's product page for the Ryzen 7 7735U provides more clarity on the GPU's clocks, the above screenshot brings out the presence of ray tracing capabilities - a first for an integrated GPU.
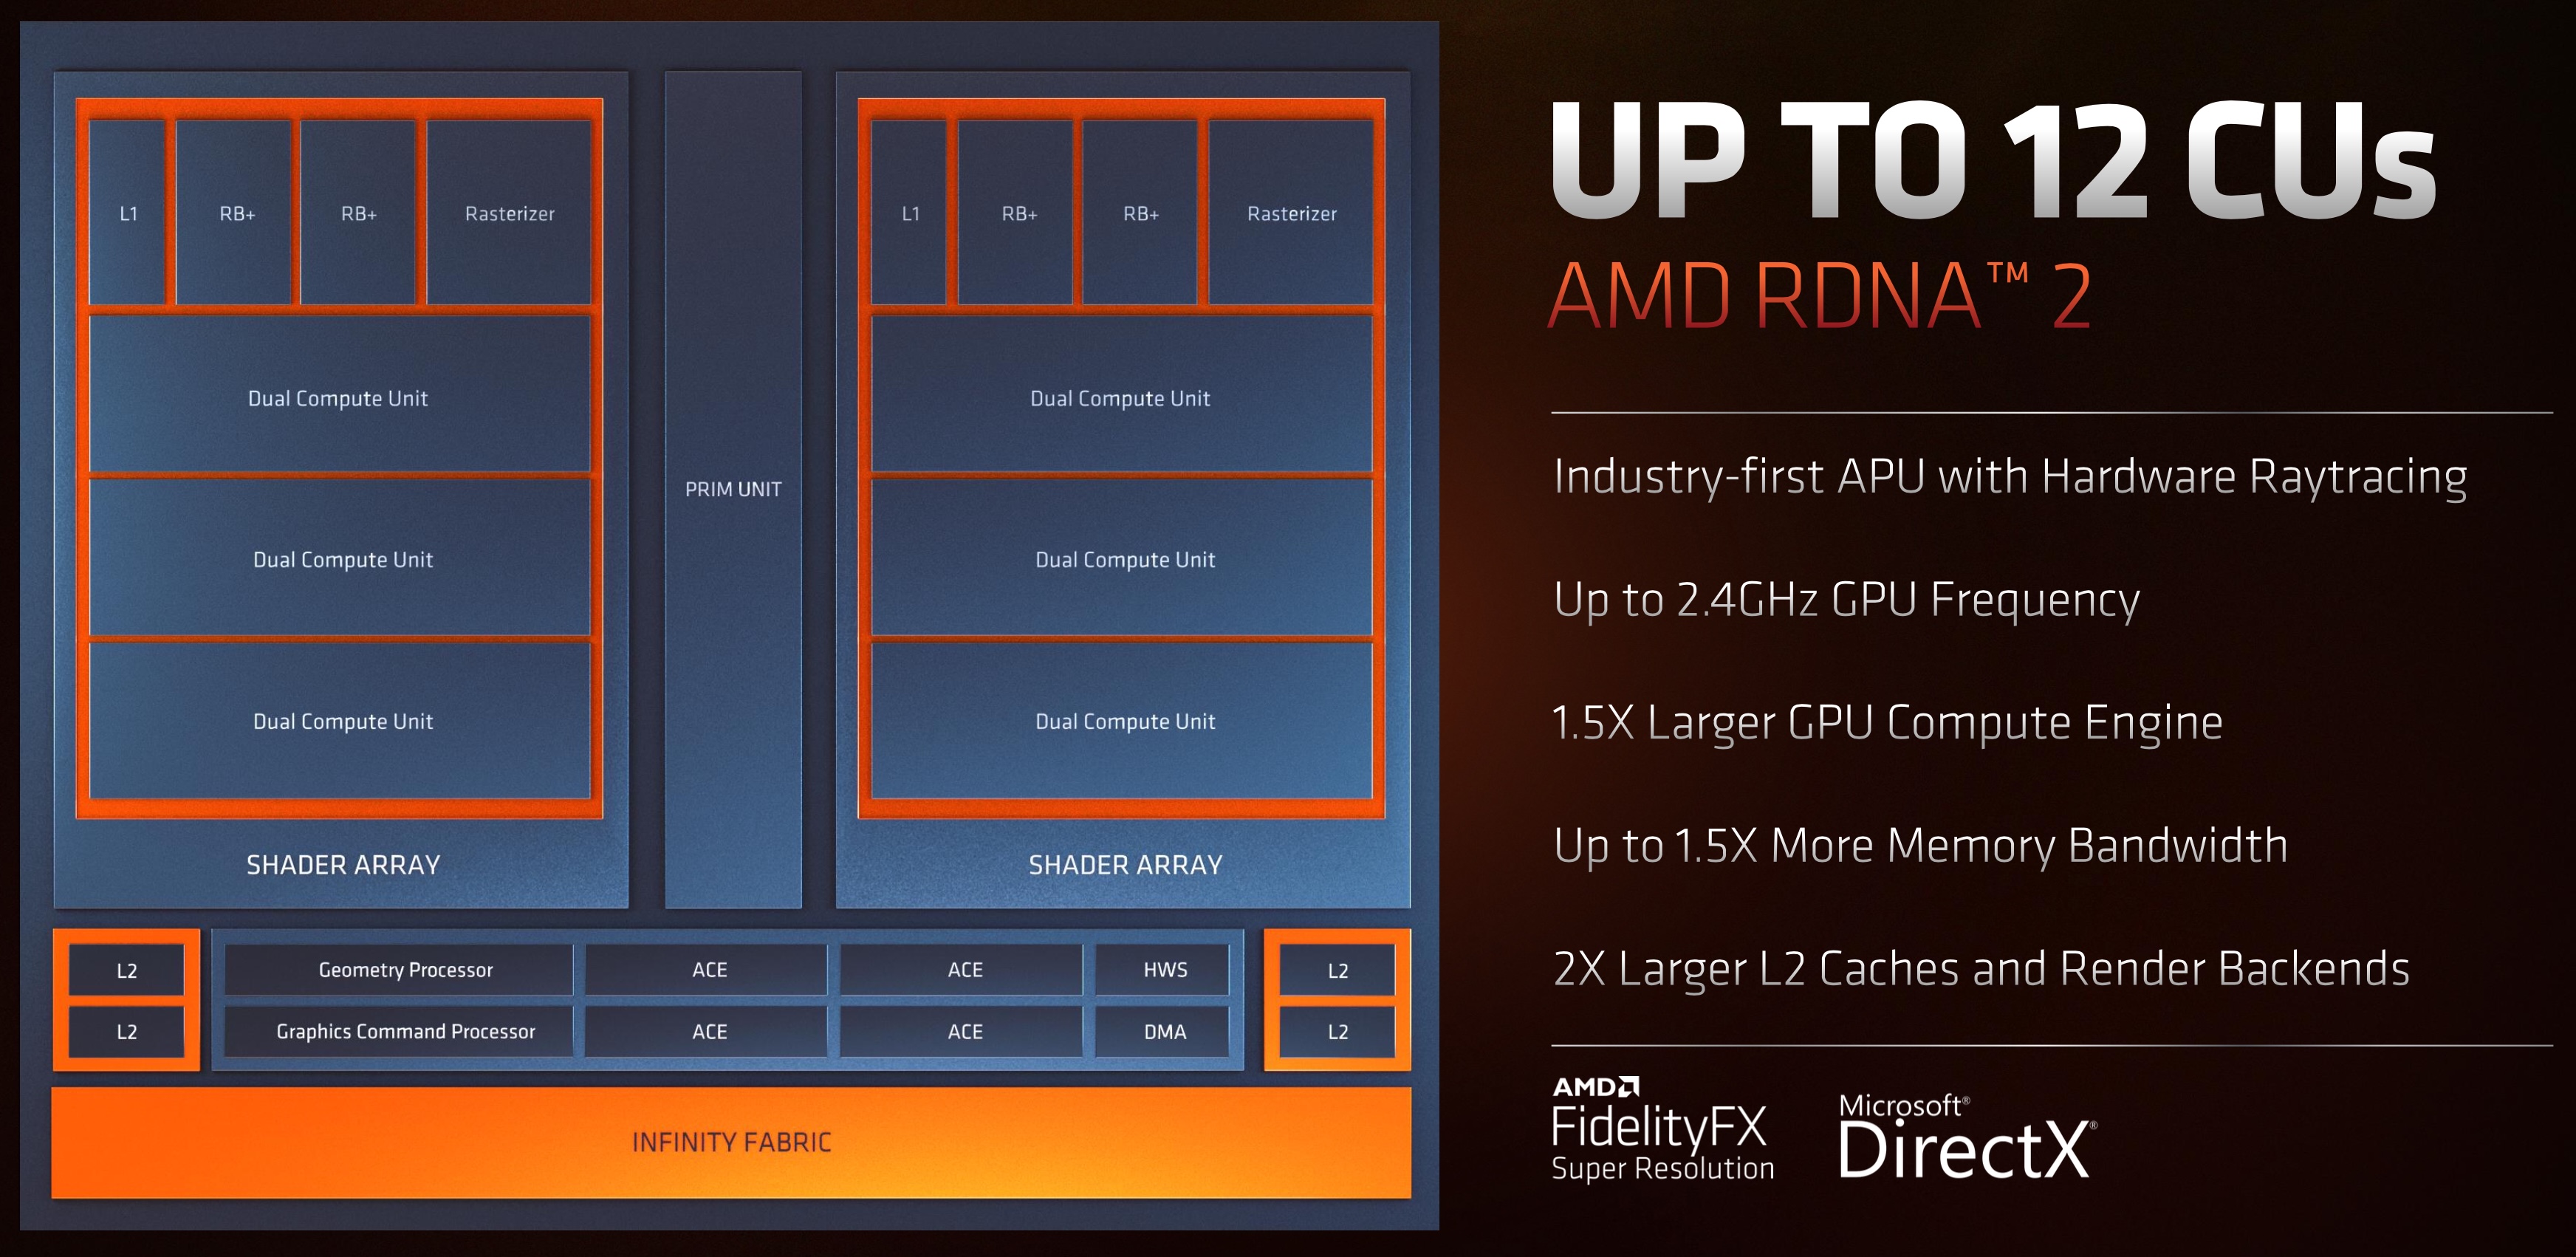
AMD Radeon 680M Features
In the ray tracing department, Rembrandt-R already scores over Intel's latest iGPU. The remaining subsections below look into the performance aspects.
GFXBench
The DirectX 12-based GFXBench tests from Kishonti are cross-platform, and available all the way down to smartphones. As such, they are not very taxing for discrete GPUs and modern integrated GPUs. We processed the offscreen versions of the 'Aztec Ruins' benchmark.
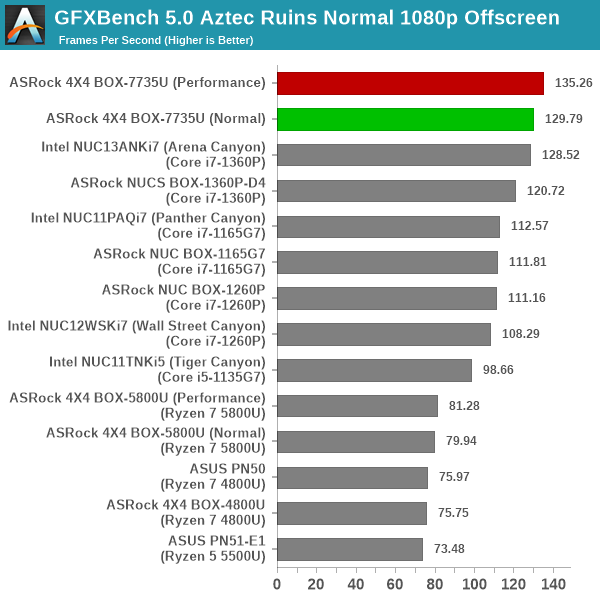
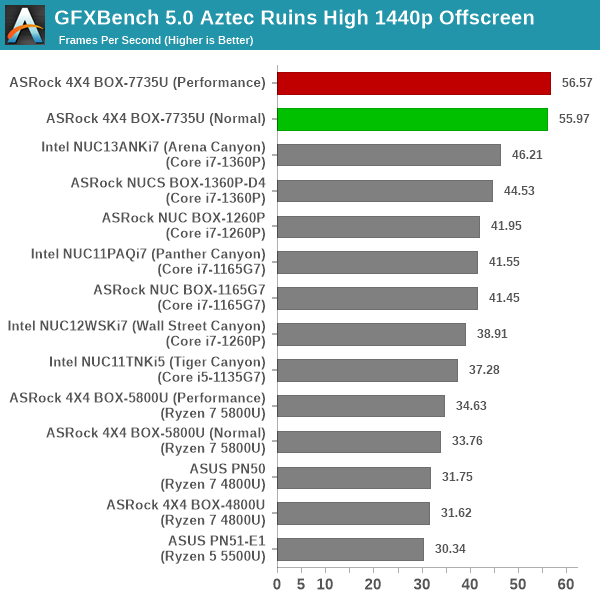
The Radeon 680M has a significant edge over the iGPU in ADL-P / RPL-P, particularly at higher resolutions.
UL 3DMark
Four different workload sets were processed in 3DMark on almost all of the systems in the comparison list - Fire Strike, Time Spy, Night Raid, and Wild Life. Port Royal was also processed on the 4X4 BOX-7735U/D5 alone.
3DMark Fire Strike
The Fire Strike benchmark has three workloads. The base version is meant for high-performance gaming PCs. It uses DirectX 11 (feature level 11) to render frames at 1920 x 1080. The Extreme version targets 1440p gaming requirements, while the Ultra version targets 4K gaming system, and renders at 3840 x 2160.
| UL 3DMark - Fire Strike Workloads | |||
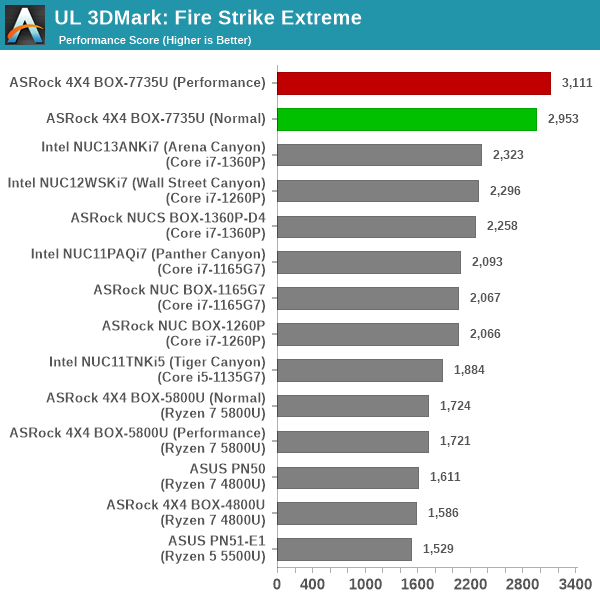
The graph above presents the overall score for the Fire Strike Extreme and Fire Strike Ultra benchmark across all the systems that are being compared. In both versions, the Radeon 680M outperforms the rest of the pack by a significant margin.
3DMark Time Spy
The Time Spy workload has two levels with different complexities. Both use DirectX 12 (feature level 11). However, the plain version targets high-performance gaming PCs with a 2560 x 1440 render resolution, while the Extreme version renders at 3840 x 2160 resolution. The graphs below present both numbers for all the systems that are being compared in this review.
| UL 3DMark - Time Spy Workloads | |||
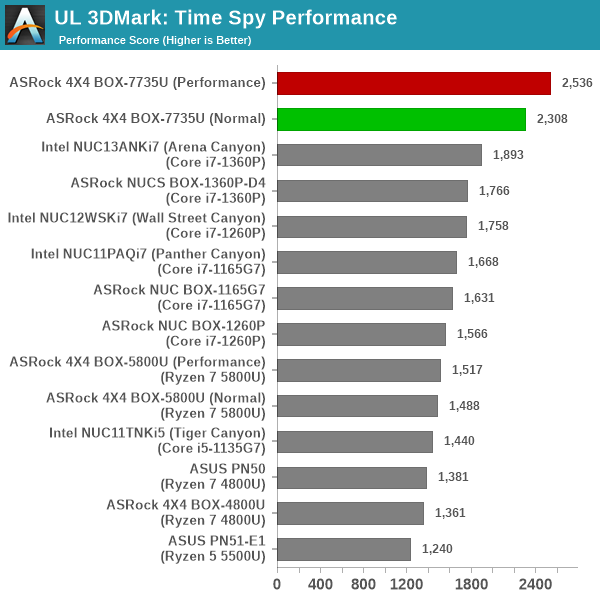
The performance advantage of the Radeon 680M is again eveident in this workload.
3DMark Wild Life
The Wild Life workload was initially introduced as a cross-platform GPU benchmark in 2020. It renders at a 2560 x 1440 resolution using Vulkan 1.1 APIs on Windows. It is a relatively short-running test, reflective of mobile GPU usage. In mid-2021, UL released the Wild Life Extreme workload that was a more demanding version that renders at 3840 x 2160 and runs for a much longer duration reflective of typical desktop gaming usage.
| UL 3DMark - Wild Life Workloads | |||
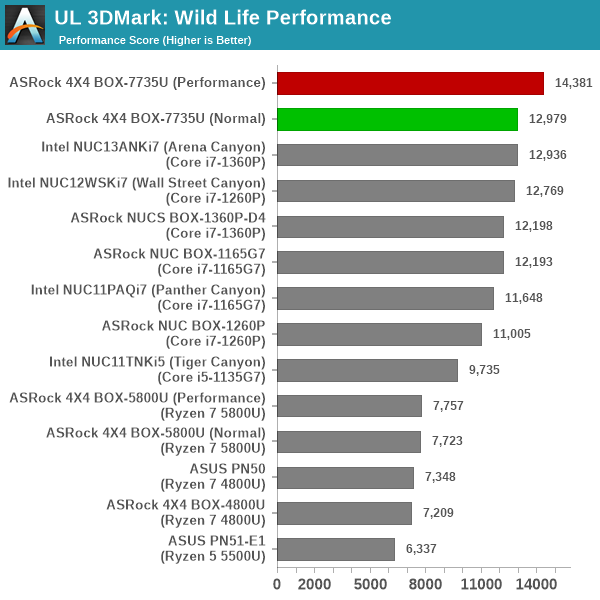
This workload appears to be sensitive to the available power budget. But, even at 28W, the Radeon 680M in the 4X4 BOX-7735U/D5 is able to surpass the 40W Arena Canyon NUC.
3DMark Night Raid
The Night Raid workload is a DirectX 12 benchmark test. It is less demanding than Time Spy, and is optimized for integrated graphics. The graph below presents the overall score in this workload for different system configurations.
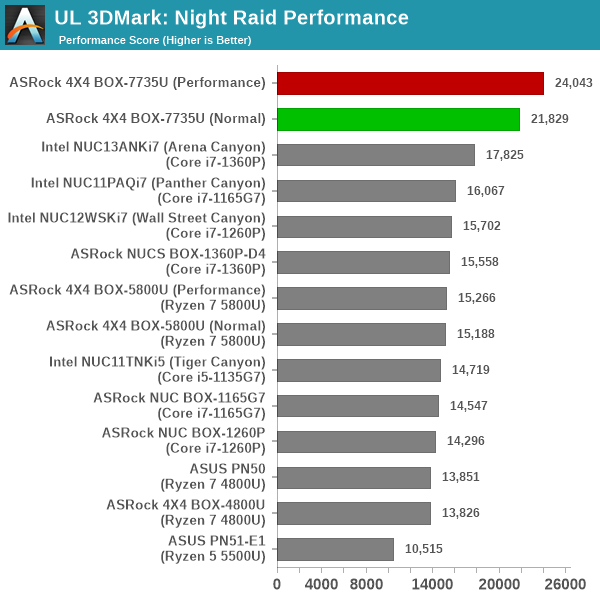
As expected, this is a cakewalk for the RDNA2-based Radeon 680M.
3DMark Port Royal
UL introduced the Port Royal ray-tracing benchmark as a DLC for 3DMark in early 2019. The scores serve as an indicator of how the system handles ray-tracing effects in real-time.
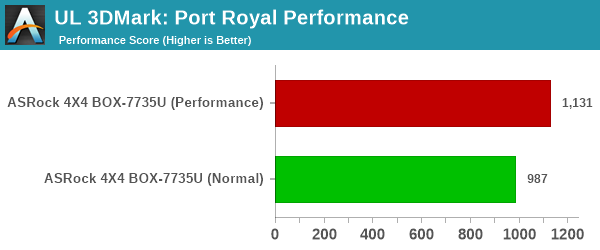
With no other system capable of handling this workload, this is a lonely comparison that only shows that an increase in the power budget can deliver better performance.
System Performance: Multi-Tasking
One of the key drivers of advancements in computing systems is multi-tasking. On mobile devices, this is quite lightweight - cases such as background email checks while the user is playing a mobile game are quite common. Towards optimizing user experience in those types of scenarios, mobile SoC manufacturers started integrating heterogeneous CPU cores - some with high performance for demanding workloads, while others were frugal in terms of both power consumption / die area and performance. This trend is now slowly making its way into the desktop PC space.
Multi-tasking in typical PC usage is much more demanding compared to phones and tablets. Desktop OSes allow users to launch and utilize a large number of demanding programs simultaneously. Responsiveness is dictated largely by the OS scheduler allowing different tasks to move to the background. Intel's Alder Lake processors work closely with the Windows 11 thread scheduler to optimize performance in these cases. Keeping these aspects in mind, the evaluation of multi-tasking performance is an interesting subject to tackle.
We have augmented our systems benchmarking suite to quantitatively analyze the multi-tasking performance of various platforms. The evaluation involves triggering a ffmpeg transcoding task to transform 1716 3840x1714 frames encoded as a 24fps AVC video (Blender Project's 'Tears of Steel' 4K version) into a 1080p HEVC version in a loop. ffmpeg is configured to use the x265 encoder, and the settings are configured to allow the CPU usage to be saturated across all cores. The transcoding rate is monitored continuously. One complete transcoding pass is allowed to complete before starting the first multi-tasking workload - the PCMark 10 Extended bench suite. A comparative view of the PCMark 10 scores for various scenarios is presented in the graphs below. Also available for concurrent viewing are scores in the normal case where the benchmark was processed without any concurrent load, and a graph presenting the loss in performance.
| UL PCMark 10 Load Testing - Digital Content Creation Scores | |||

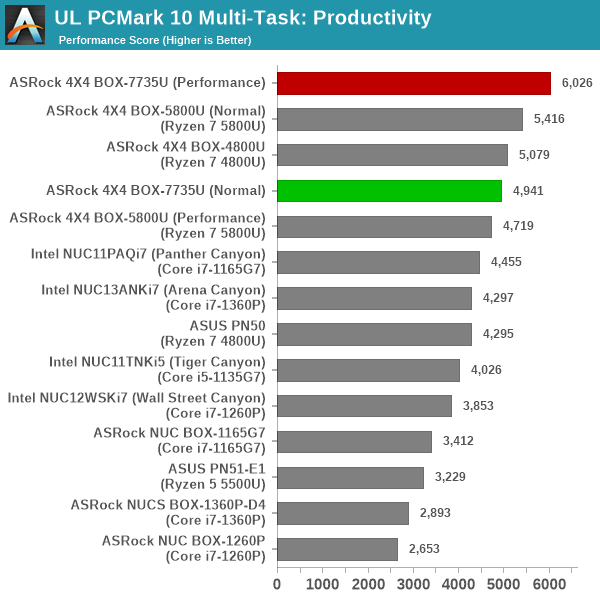
| UL PCMark 10 Load Testing - Productivity Scores | |||
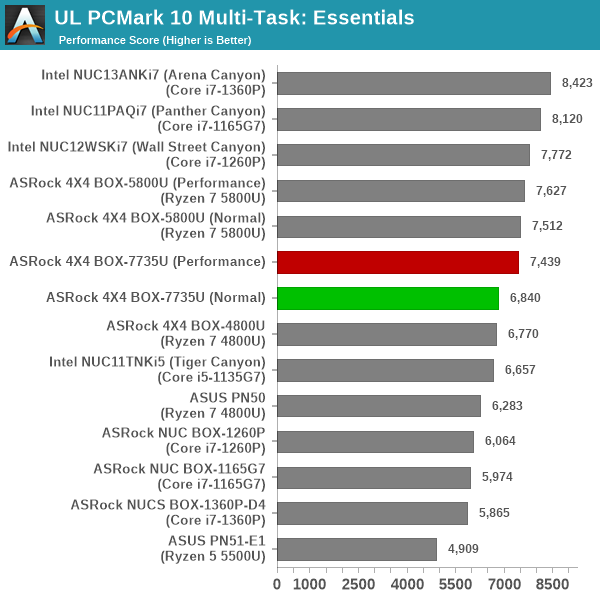
| UL PCMark 10 Load Testing - Essentials Scores | |||
| UL PCMark 10 Load Testing - Gaming Scores | |||

| UL PCMark 10 Load Testing - Overall Scores | |||
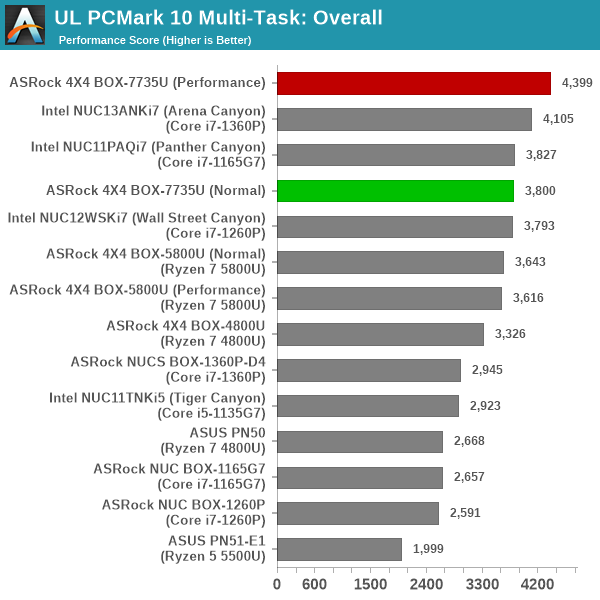
The relative ordering of the systems doesn't change much irrespective of the concurrent load. However, we do see a slight benefit for the heterogeneous processors when performance loss percentages are computed.
Following the completion of the PCMark 10 benchmark, a short delay is introduced prior to the processing of Principled Technologies WebXPRT4 on MS Edge. Similar to the PCMark 10 results presentation, the graph below show the scores recorded with the transcoding load active. Available for comparison are the dedicated CPU power scores and a measure of the performance loss.
| Principled Technologies WebXPRT4 Load Testing Scores (MS Edge) | |||

The final workload tested as part of the multitasking evaluation routine is CINEBENCH R23.
| 3D Rendering - CINEBENCH R23 Load Testing - Single Thread Score | |||

| 3D Rendering - CINEBENCH R23 Load Testing - Multiple Thread Score | |||

Without hetergeneous cores to worry about, we actually see the Rembrandt-R configurations acquitting themselves rather well in the rendering workloads which tend to stress the system more heavily and keep the workload across different threads largely the same. This is more challenging for ADL-P and RPL-P.
After the completion of all the workloads, we let the transcoding routine run to completion. The monitored transcoding rate throughout the above evaluation routine (in terms of frames per second) is graphed below.
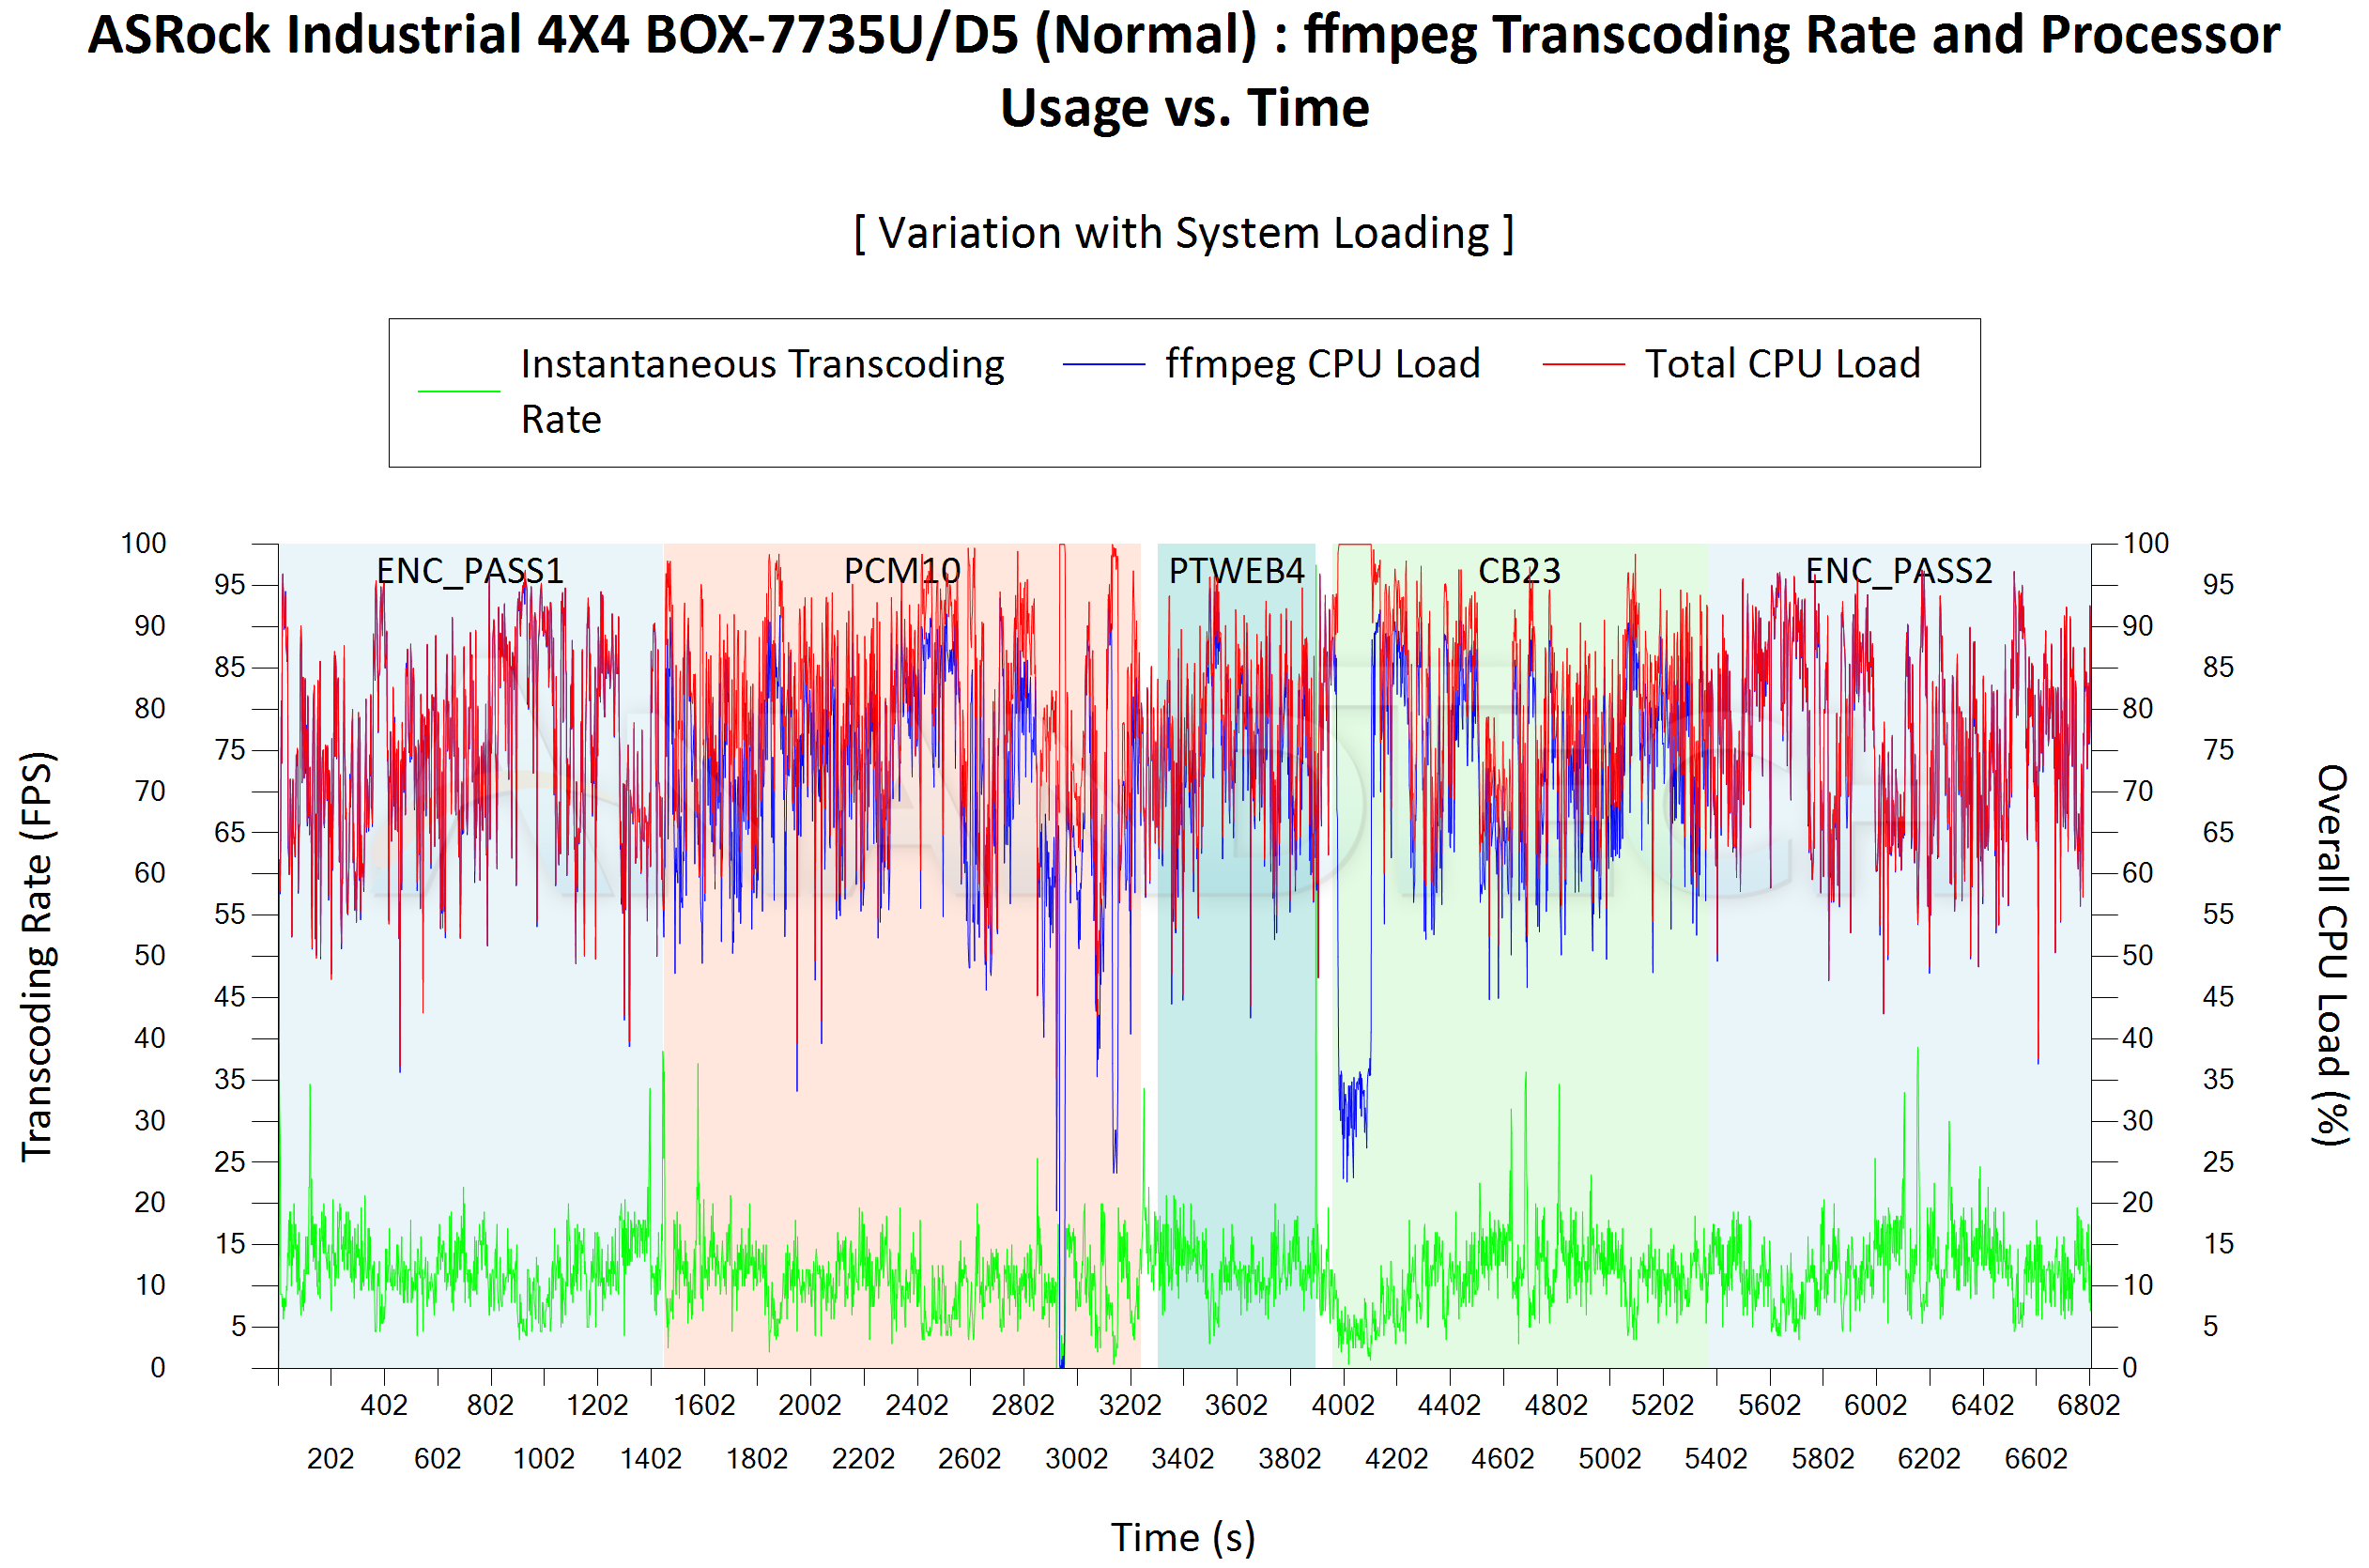

In the above scenario, the transcoding task is supposed to happen in the background. The user should ideally not care about the transcoding performance in that case, but it is still interesting to look into how that varies based on the concurrent load being applied.
| ASRock Industrial 4X4 BOX-7735U/D5 (Normal) ffmpeg Transcoding Rate (Multi-Tasking Test) | |||
| Task Segment | Transcoding Rate (FPS) | ||
| Minimum | Average | Maximum | |
| Transcode Start Pass | 3.5 | 12.2 | 39.5 |
| PCMark 10 | 0 | 10.55 | 37 |
| WebXPRT 4 | 3 | 12.16 | 21 |
| Cinebench R23 | 0.5 | 10.92 | 36 |
| Transcode End Pass | 3.5 | 12.26 | 39 |
| ASRock Industrial 4X4 BOX-7735U/D5 (Performance) ffmpeg Transcoding Rate (Multi-Tasking Test) | |||
| Task Segment | Transcoding Rate (FPS) | ||
| Minimum | Average | Maximum | |
| Transcode Start Pass | 4 | 14.09 | 43 |
| PCMark 10 | 0 | 12.41 | 38 |
| WebXPRT 4 | 4.5 | 12.6 | 23 |
| Cinebench R23 | 2.5 | 13.33 | 41 |
| Transcode End Pass | 3 | 14.12 | 43.5 |
Despite the addition of heavy concurrent loading, we see that the drop in transcoding performance is not too worrisome outside of full saturation regions from the foreground tasks.
Digital Signage and HTPC Credentials
The 2022 Q4 update to our system reviews brings an updated HTPC evaluation suite for systems. After doing away with the evaluation of display refresh rate stability and Netflix streaming evaluation, the local media playback configurations have also seen a revamp. This section details each of the workloads processed on the ASRock 4X4 BOX-7735U/D5 as part of the HTPC suite.
YouTube Streaming Efficiency
YouTube continues to remain one of the top OTT platforms, primarily due to its free ad-supported tier. Our HTPC test suite update retains YouTube streaming efficiency evaluation as a metric of OTT support in different systems. Mystery Box's Peru 8K HDR 60FPS video is the chosen test sample. On PCs running Windows, it is recommended that HDR streaming videos be viewed using the Microsoft Edge browser after putting the desktop in HDR mode.
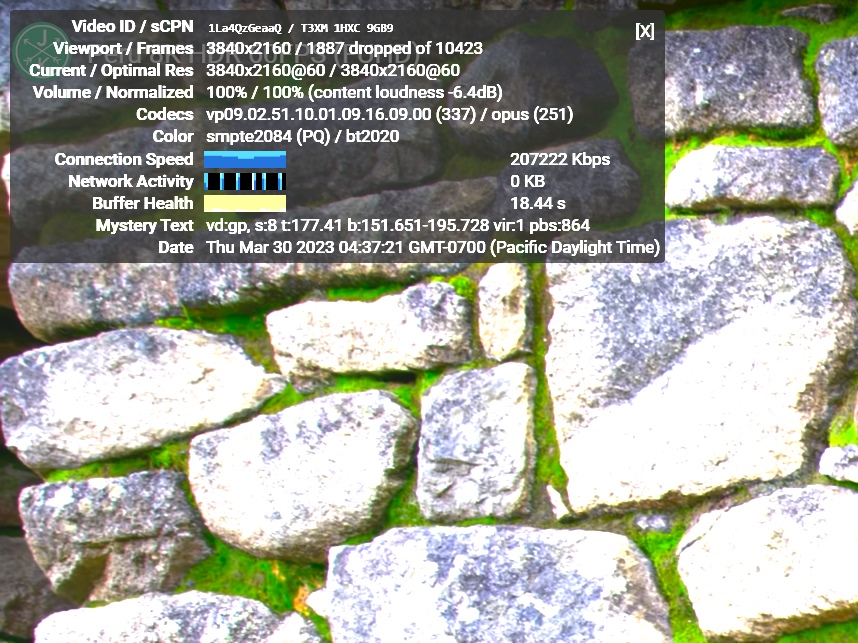
YouTube Streaming Statistics - Normal Mode

YouTube Streaming Statistics - Performance Mode
The GPU in the 4X4 BOX-7735U supports hardware decoding of VP9 Profile 2, and we see the stream encoded with that codec being played back. The streaming is largely perfect, but does suffer from dropped frames whenever any overlay is active. In that respect, the playback experience on Intel-based systems is much better. However, that looks likely to be driver-related - hopefully, future driver versions can provide a better experience.
The streaming efficiency-related aspects such as GPU usage and at-wall power consumption are also graphed below.
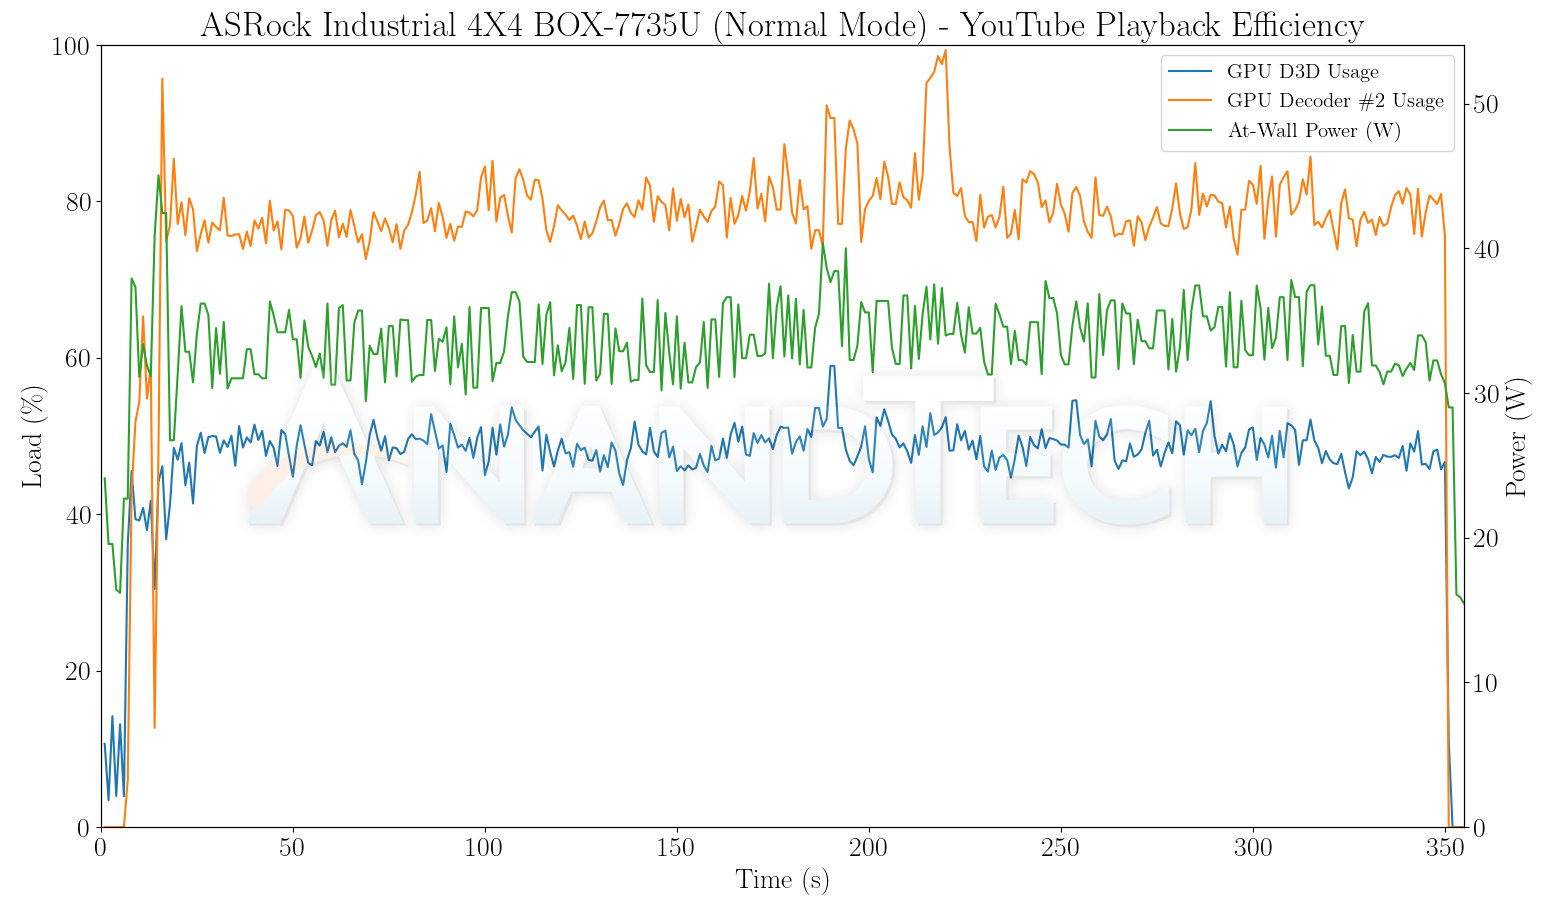
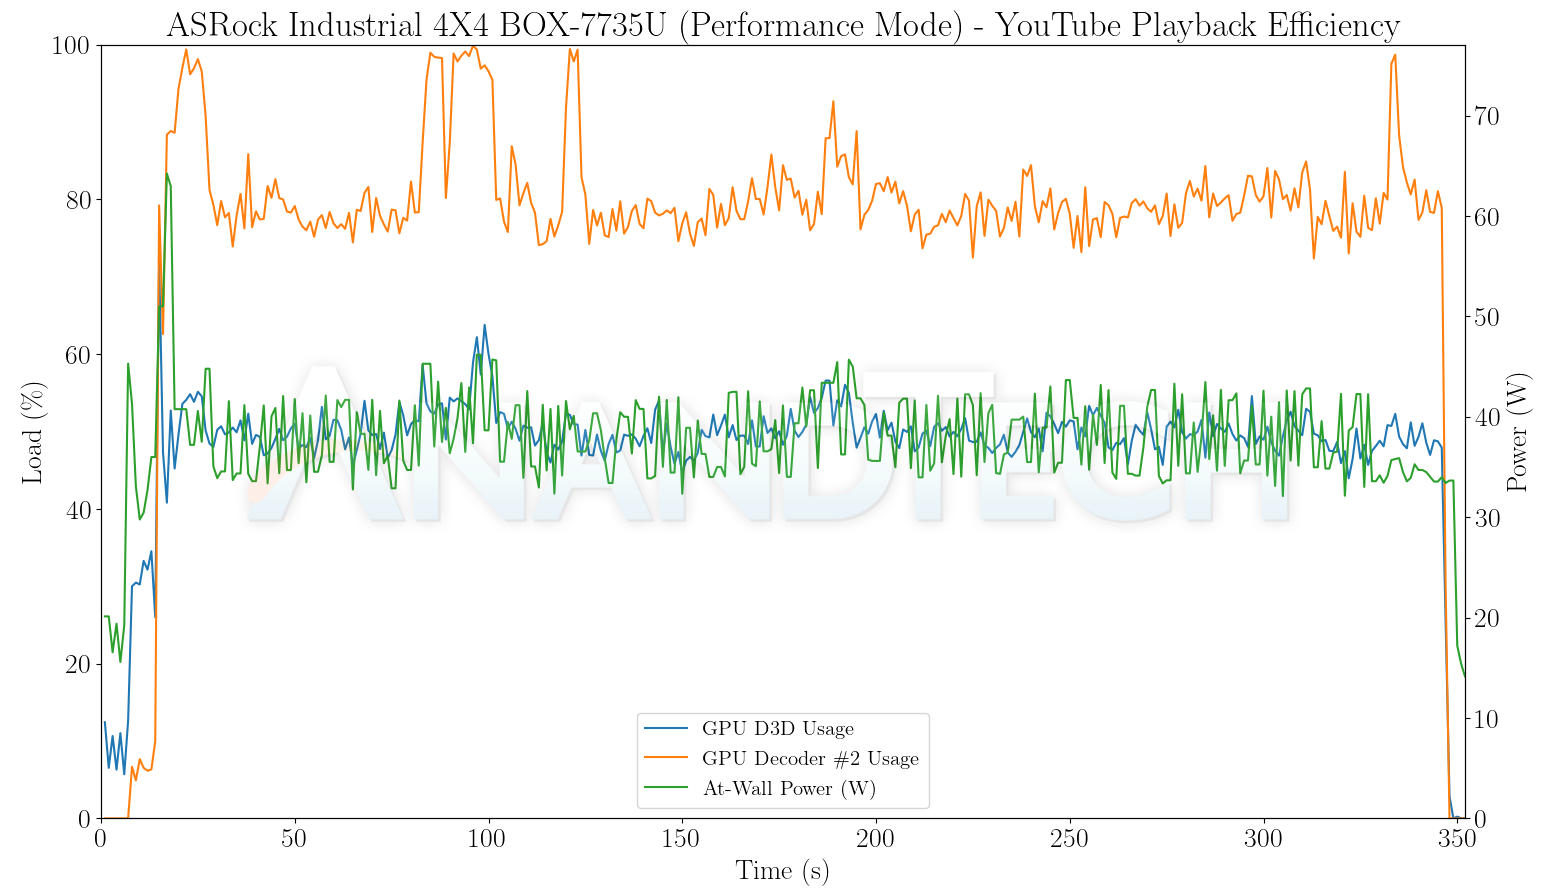
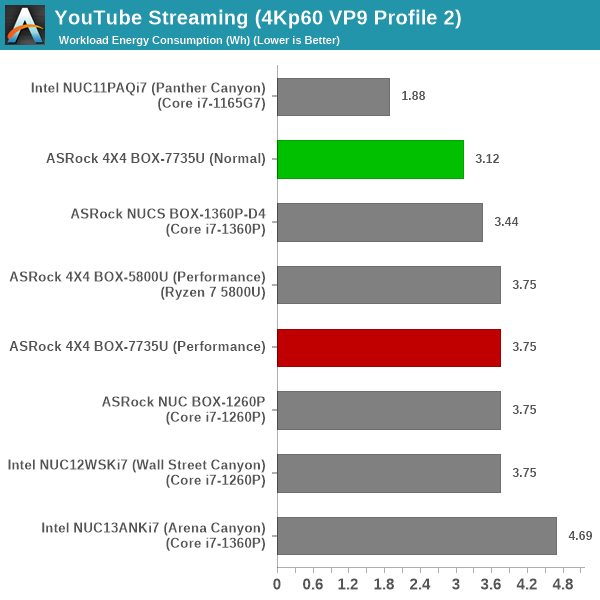
The 28W Rembrandt-R configuration is the most energy efficient of the lot when it comes to YouTube playback.
Hardware-Accelerated Encoding and Decoding
The transcoding benchmarks in the systems performance section presented results from evaluating the VCE encoder within Handbrake's framework. The capabilities of the decoder engine are brought out by DXVAChecker.

Video Decoding Hardware Acceleration in ASRock 4X4 BOX-7735U
On paper, this codec list is quite comprehensive and should cover most home consumer and digital signage requirements.
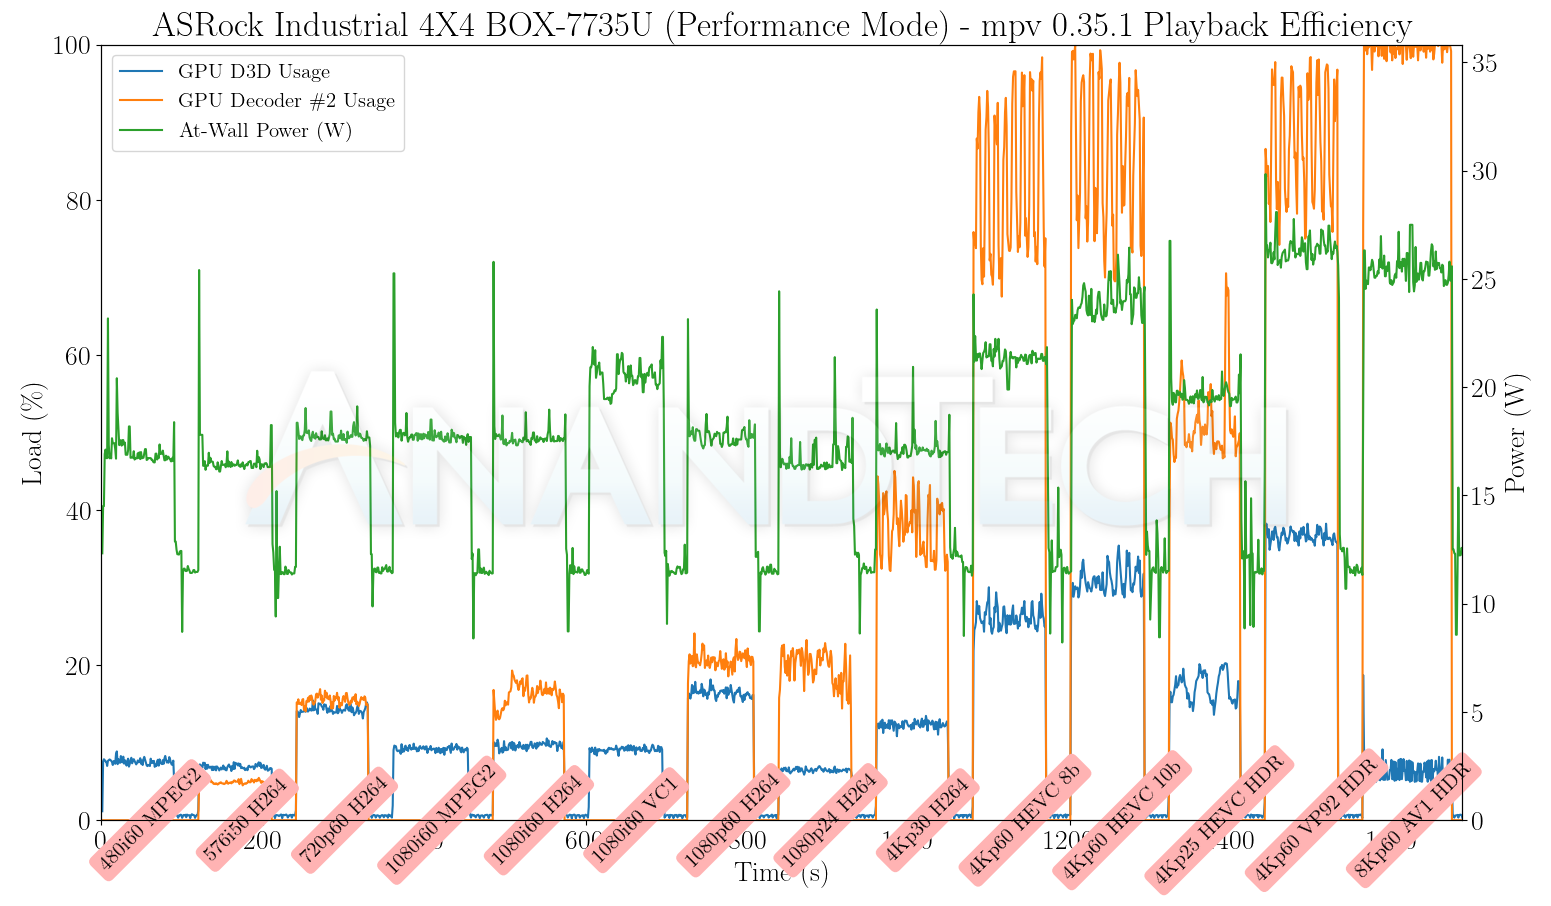
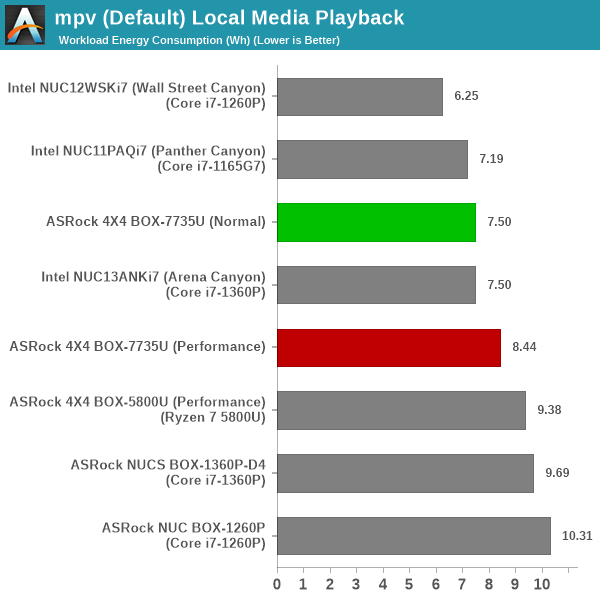
Local Media Playback
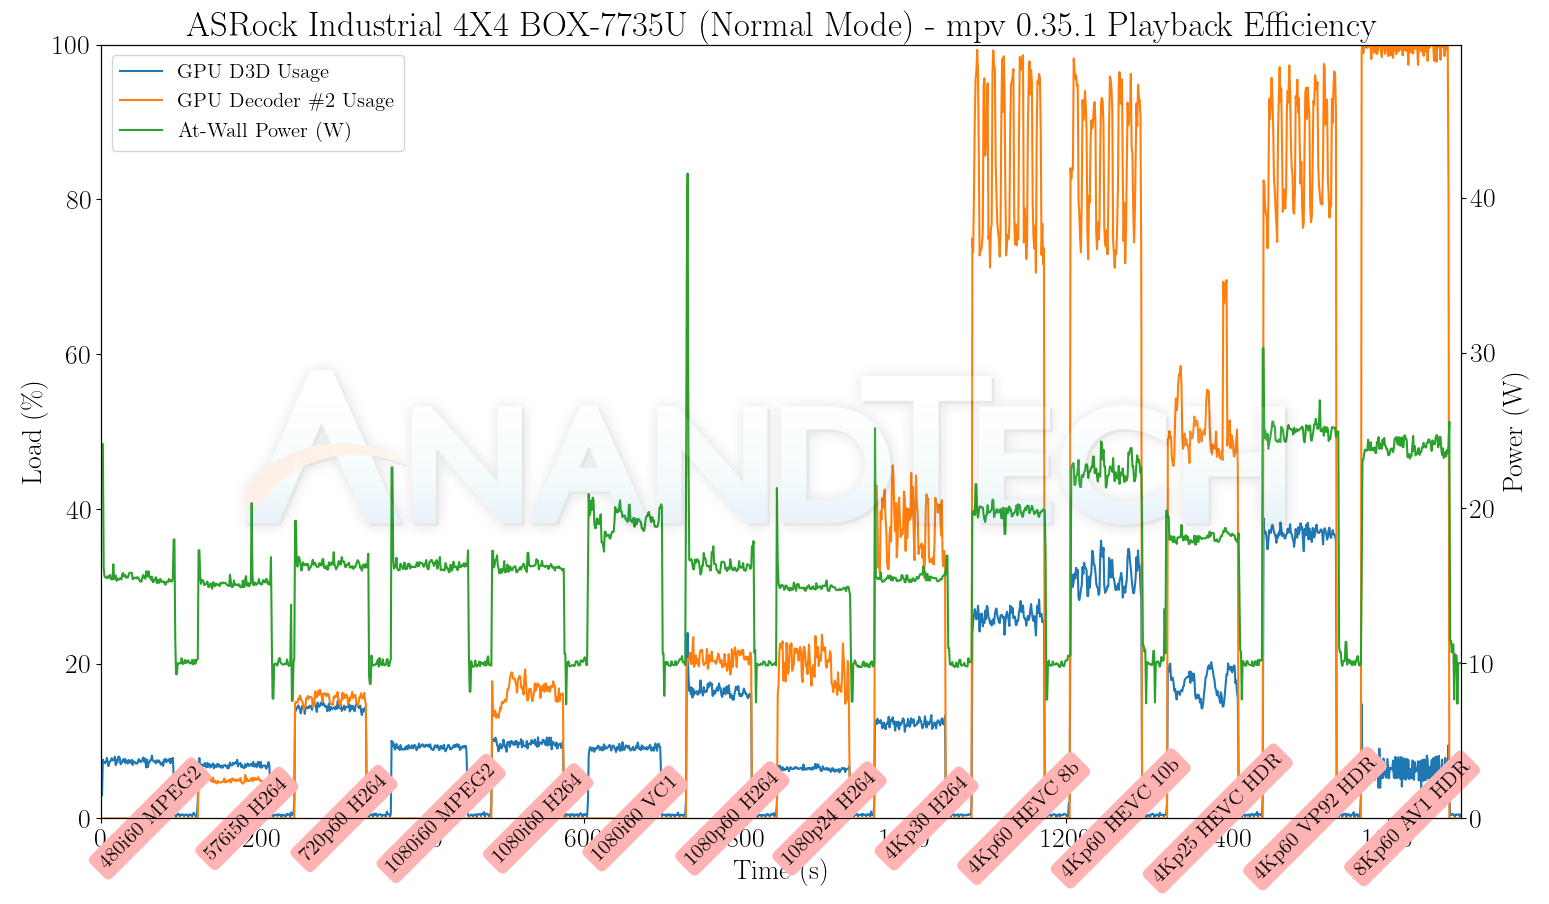
Evaluation of local media playback and video processing is done by playing back files encompassing a range of relevant codecs, containers, resolutions, and frame rates. A note of the efficiency is also made by tracking GPU usage and power consumption of the system at the wall. Users have their own preference for the playback software / decoder / renderer, and our aim is to have numbers representative of commonly encountered scenarios. Our Q4 2022 test suite update replaces MPC-HC (in LAV filters / madVR modes) with mpv. In addition to being cross-platform and open-source, the player allows easy control via the command-line to enable different shader-based post-processing algorithms. From a benchmarking perspective, the more attractive aspect is the real-time reporting of dropped frames in an easily parseable manner. The players / configurations considered in this subsection include:
- VLC 3.0.18
- Kodi 20.1
- mpv 0.35.1 (hwdec auto, vo=gpu-next)
- mpv 0.35.1 (hwdec auto, vo=gpu-next, profile=gpu-hq)
Fourteen test streams (each of 90s duration) were played back from the local disk with an interval of 30 seconds in-between. Various metrics including GPU usage, at-wall power consumption, and total energy consumption were recorded during the course of this playback.
All our playback tests were done with the desktop HDR setting turned on. It is possible for certain system configurations to automatically turn on/off the HDR capabilities prior to the playback of a HDR video, but, we didn't take advantage of that in our testing.
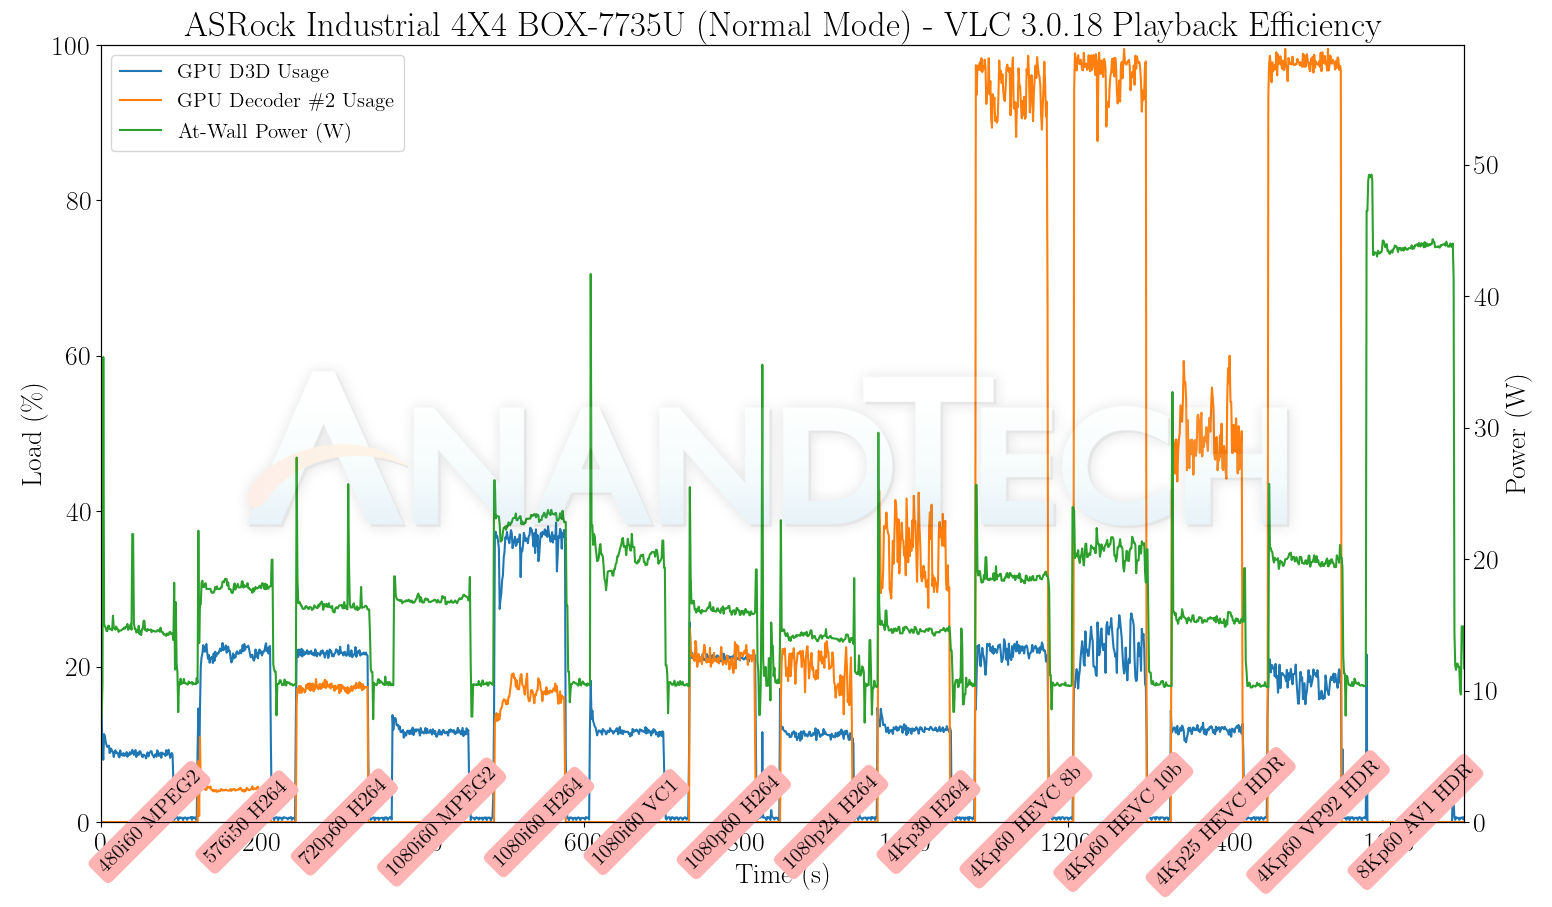
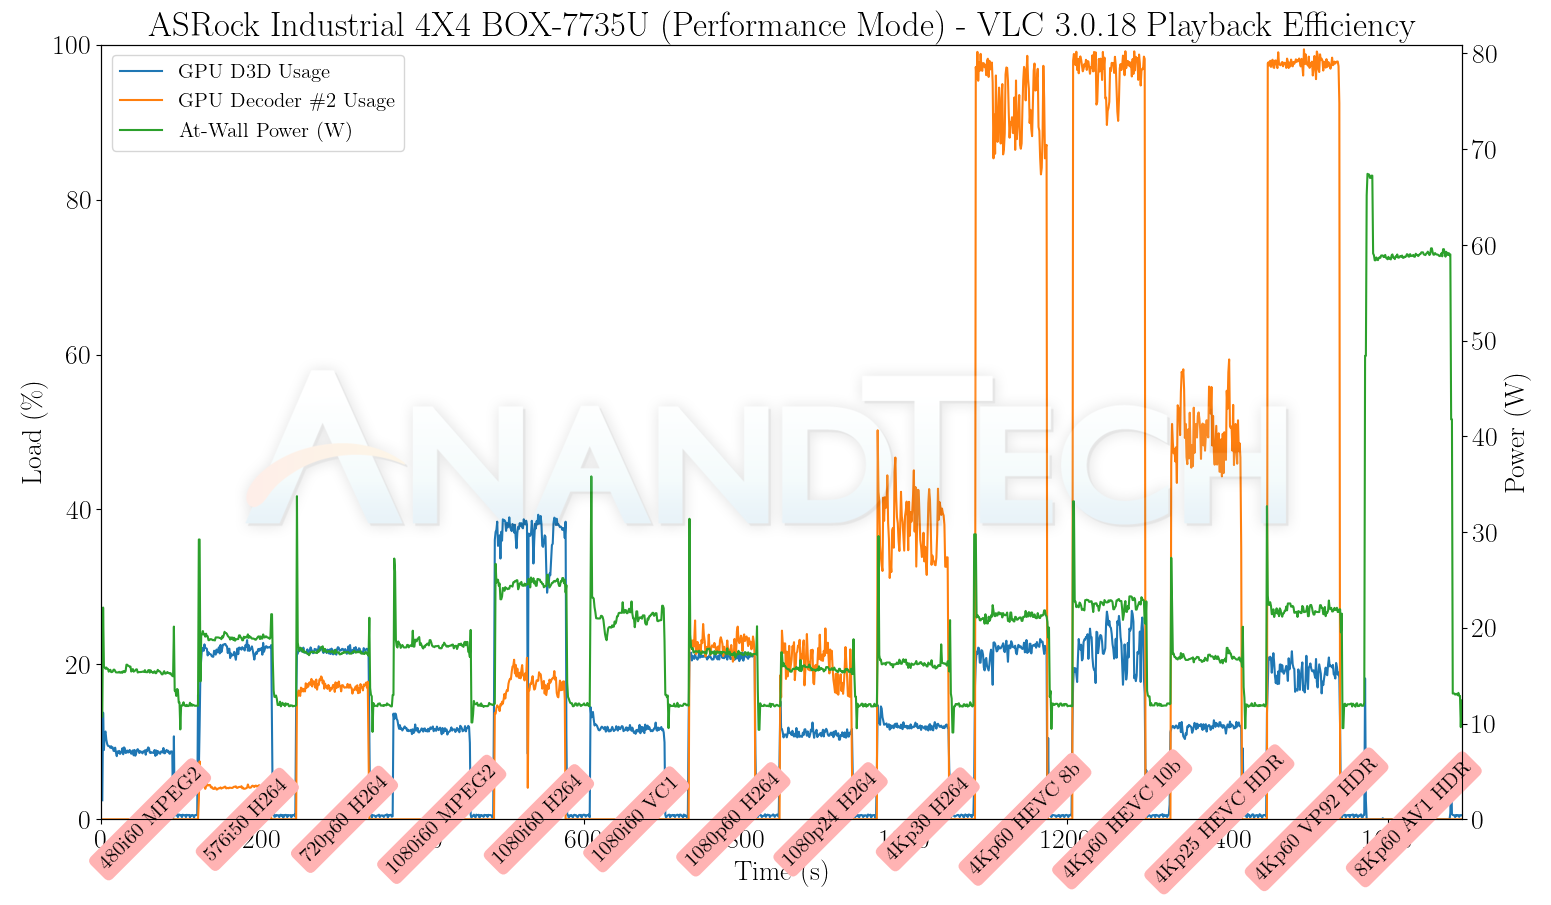

The combination of a smaller power budget and availability of hardware acceleration ensure that the 28W Rembrandt-R configuration is one of the most energy efficient systems in the mix. However, it is held back on the 'user experience' front by the lack of hardware acceleration for AV1, which results in slideshows for the 8Kp60 AV1 clip.
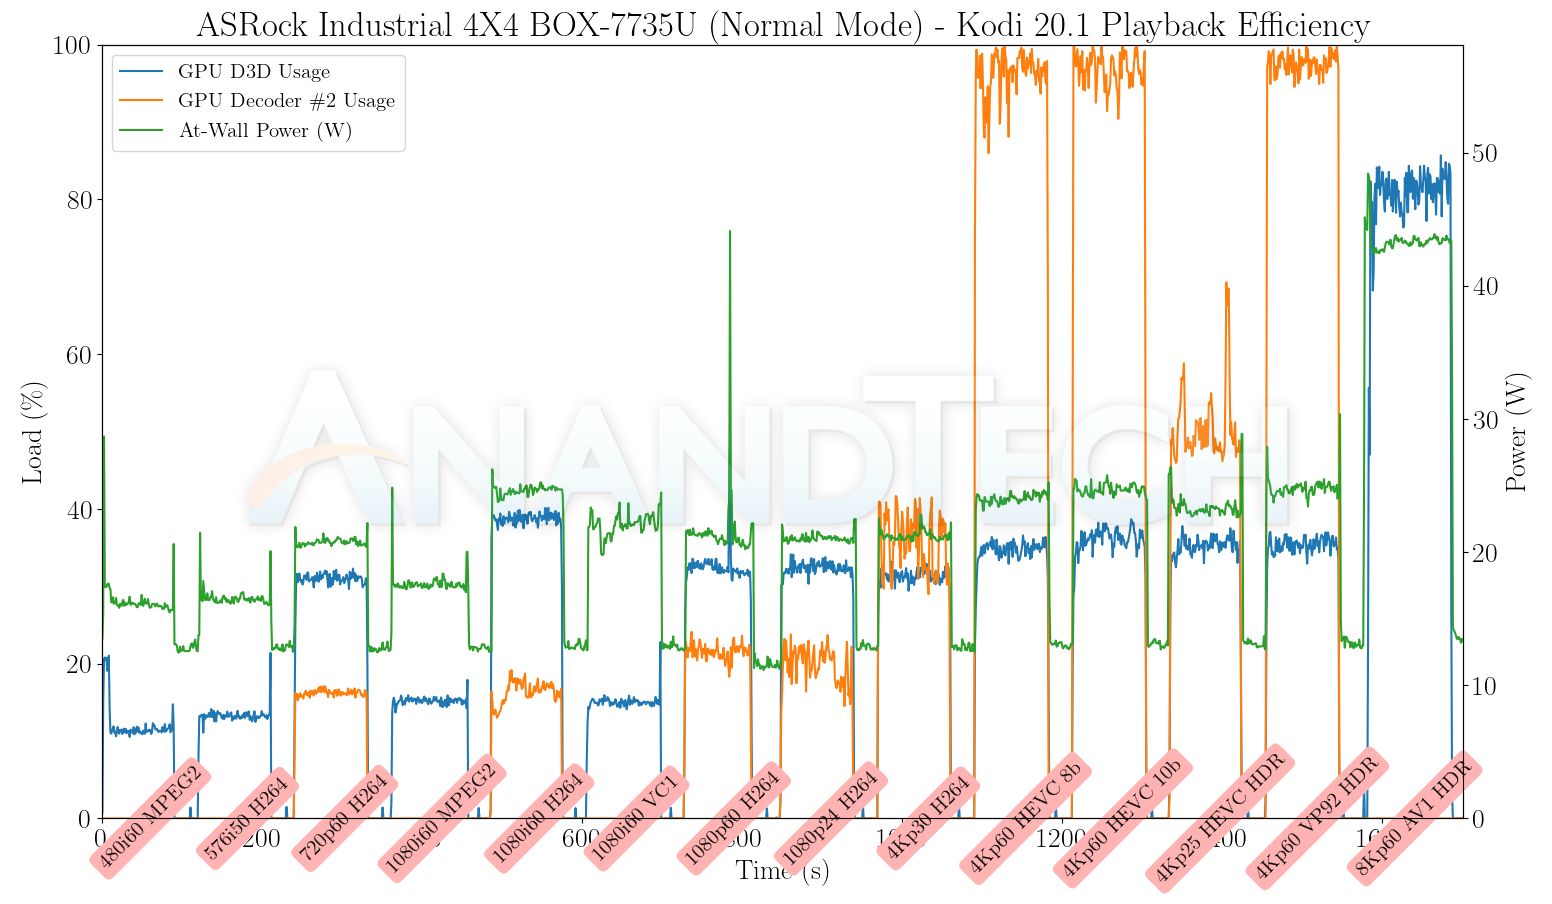
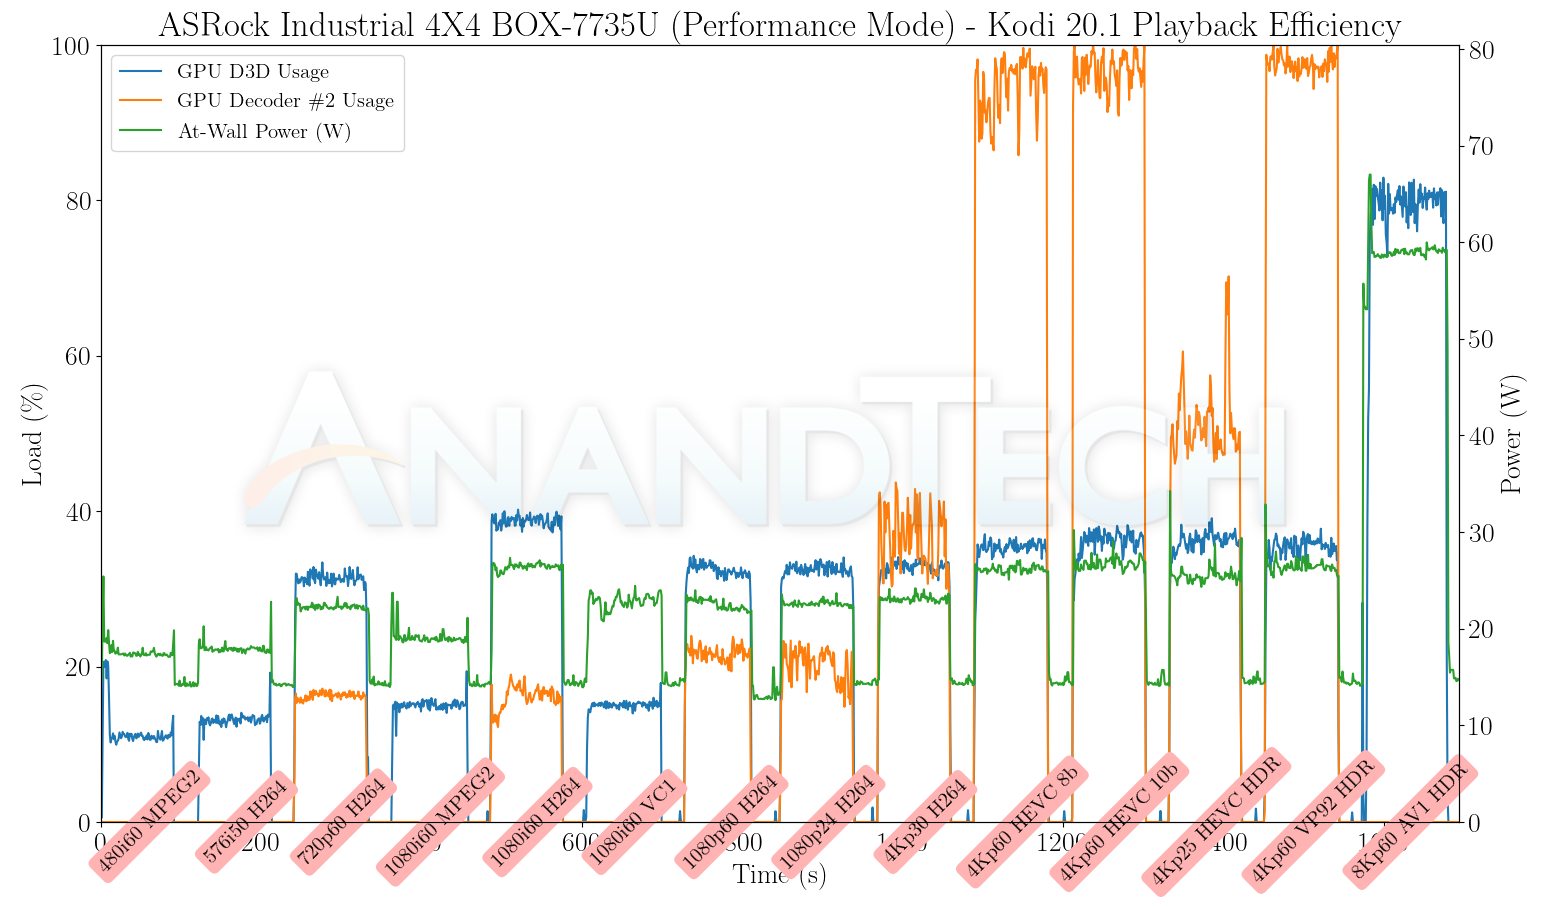
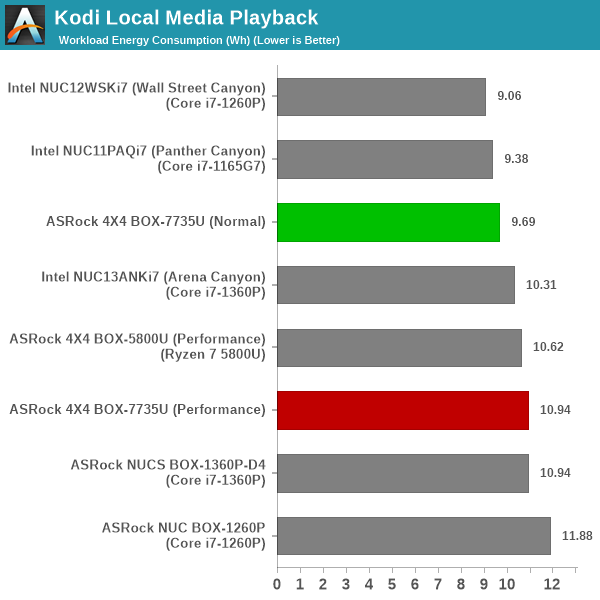
The user experience with Kodi is not much different, as AV1 hardware acceleration is again unused. Since Kodi doesn't close inbetween the different streams, the GPU remains active and continues to render the UI. This results in the energy numbers creeping up when the full playback period is considered.
We finally see AV1 decode acceleration. Unfortunately, despite the decoder engine running at full tilt, there is some problem with the video output path resulting in approximately half the frames getting dropped.


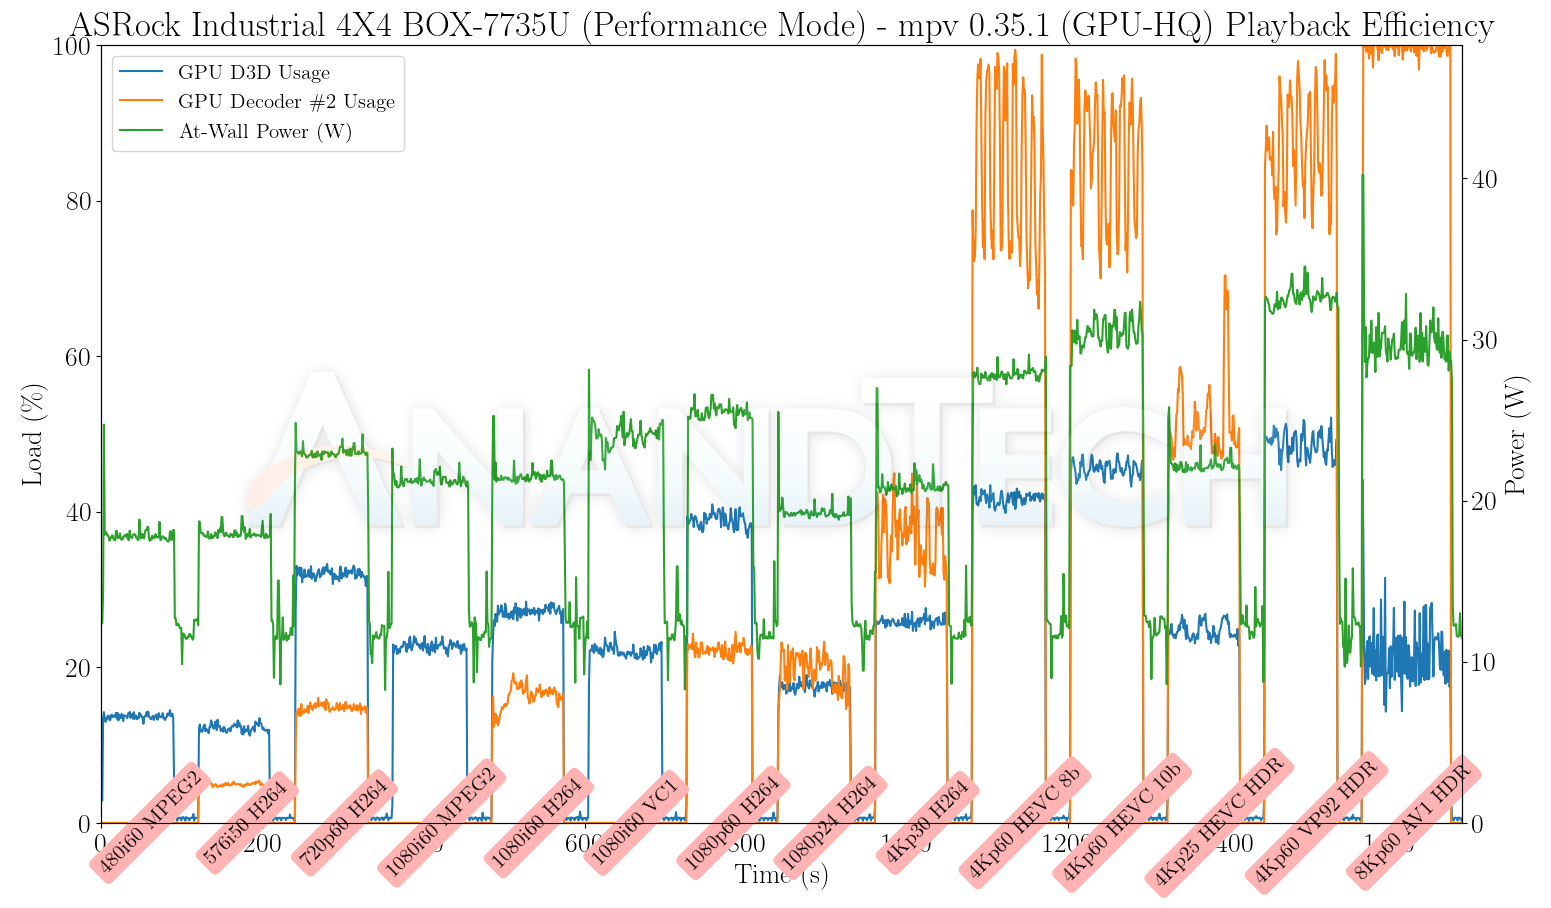

The case of the AV1 playback being spotty despite the hardware acceleration is seen here again. The energy numbers are also a bit higher, given that the GPU shaders are getting activated for the rendering.
Power Consumption and Thermal Characteristics
The power consumption at the wall was measured with a 4K display being driven through the HDMI port of the system. In the graph below, we compare the idle and load power of the ASRock 4X4 BOX-7735U/D5 in both modes with other systems evaluated before. For load power consumption, we ran the AIDA64 System Stability Test with various stress components, as well as our custom stress test with Prime95 / Furmark, and noted the peak as well as idling power consumption at the wall.
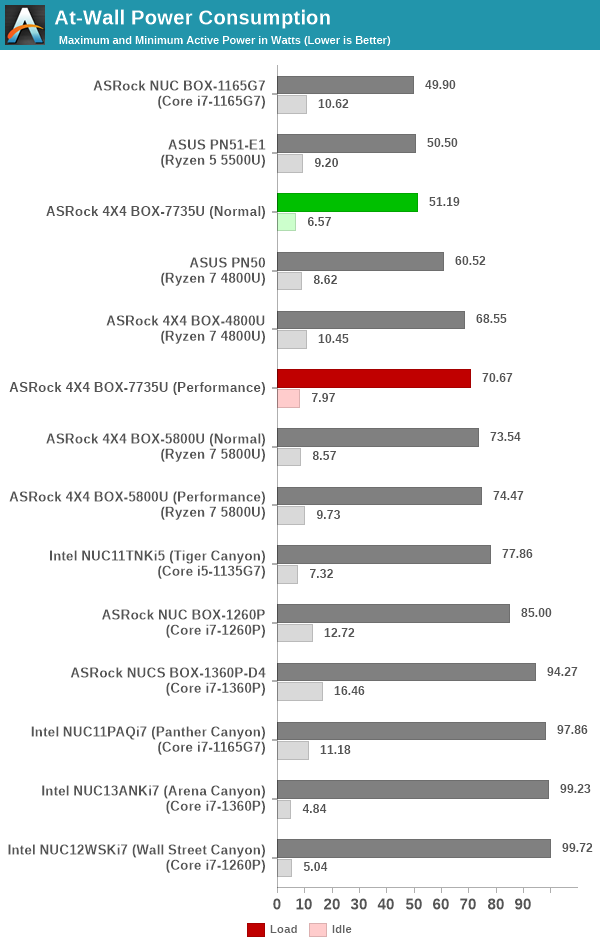
The numbers are consistent with the TDP and configured PL1 / PL2 values for the processors in the systems, and do not come as any surprise. The 28W Rembrandt-R configuration is quite effective, but ASRock Industrial's tweaking for idle power is a bit weak compared to what Intel is able to achieve with their NUCs. So, even with an excellent AMD platform (idling at 6.57W and 7.97W), the Arena Canyon and Wall Street Canyon NUCs with their 5W idling number can turn out to be more energy efficient in the long run.
Stress Testing
Our thermal stress routine is a combination of Prime95, Furmark, and Finalwire's AIDA64 System Stability Test. The following 9-step sequence is followed, starting with the system at idle:
- Start with the Prime95 stress test configured for maximum power consumption
- After 30 minutes, add Furmark GPU stress workload
- After 30 minutes, terminate the Prime95 workload
- After 30 minutes, terminate the Furmark workload and let the system idle
- After 30 minutes of idling, start the AIDA64 System Stress Test (SST) with CPU, caches, and RAM activated
- After 30 minutes, terminate the previous AIDA64 SST and start a new one with the GPU, CPU, caches, and RAM activated
- After 30 minutes, terminate the previous AIDA64 SST and start a new one with only the GPU activated
- After 30 minutes, terminate the previous AIDA64 SST and start a new one with the CPU, GPU, caches, RAM, and SSD activated
- After 30 minutes, terminate the AIDA64 SST and let the system idle for 30 minutes
Traditionally, this test used to record the clock frequencies - however, with the increasing number of cores in modern processors and fine-grained clock control, frequency information makes the graphs cluttered and doesn't contribute much to understanding the thermal performance of the system. The focus is now on the power consumption and temperature profiles to determine if throttling is in play.
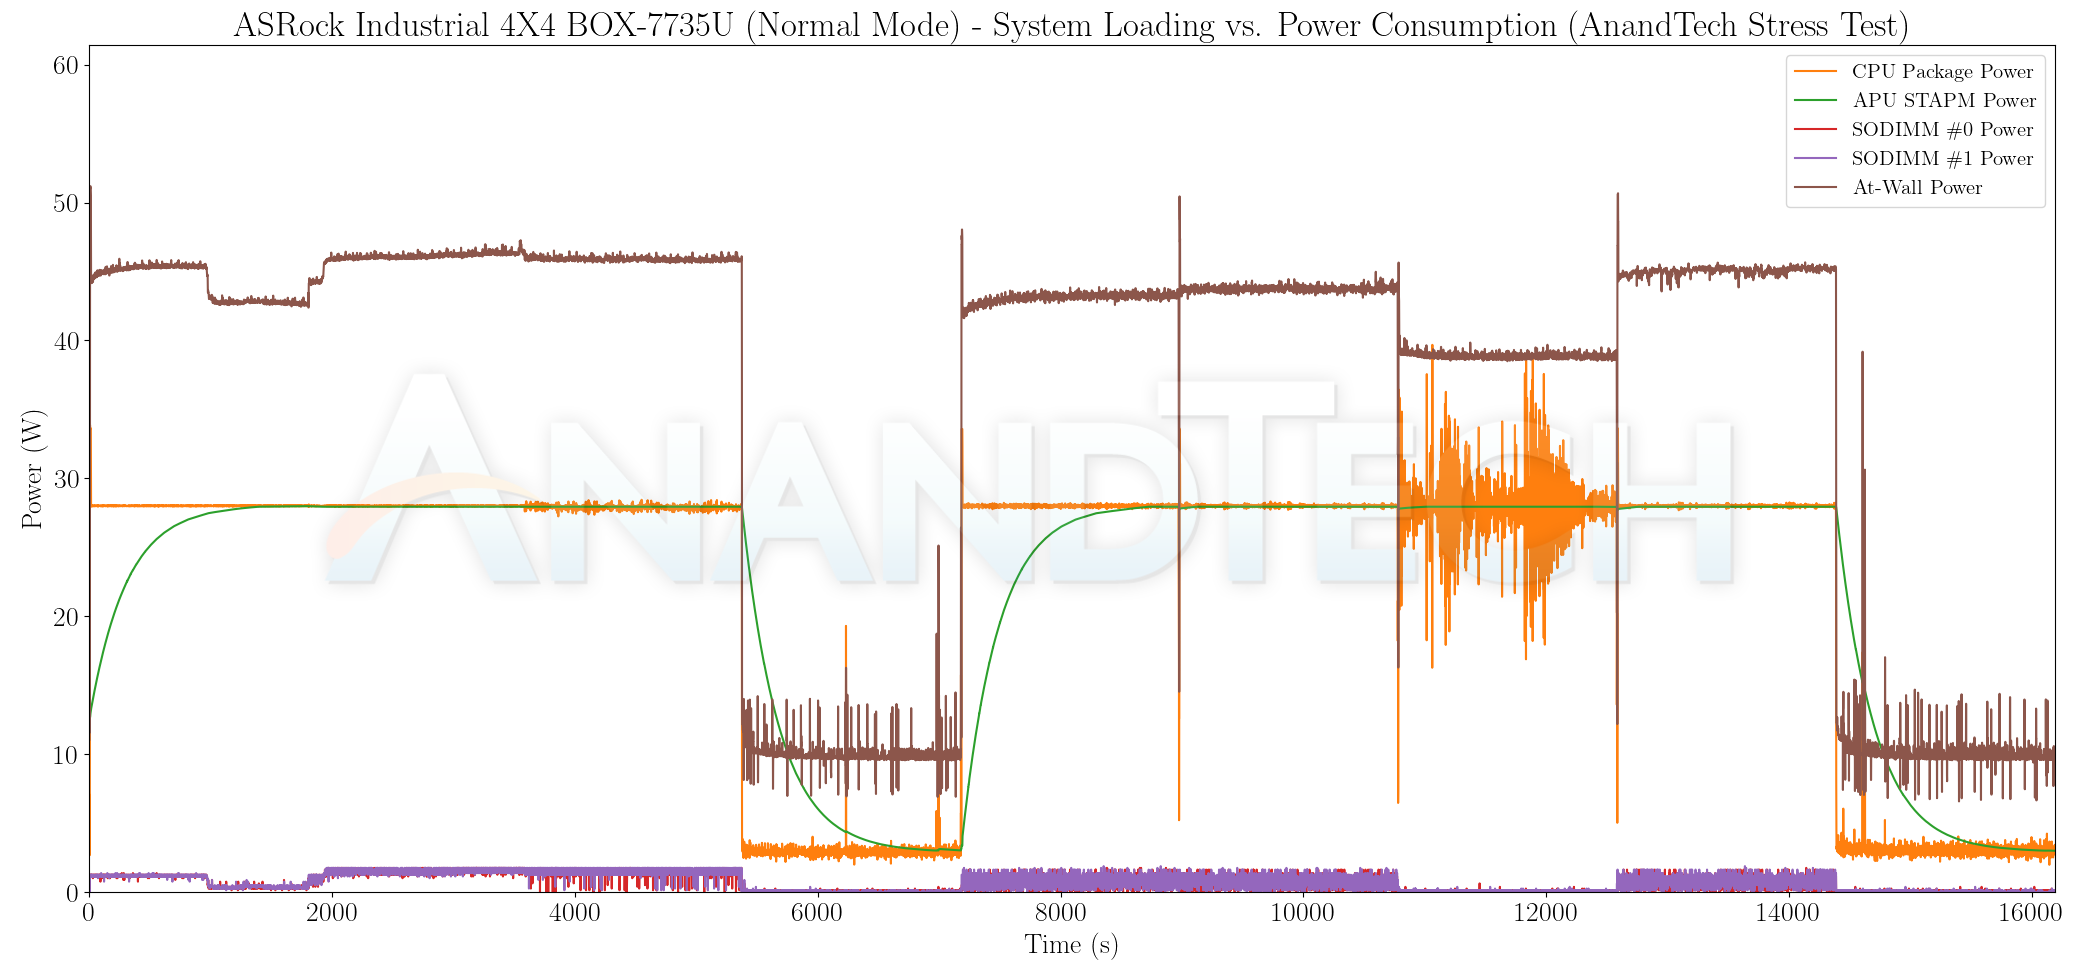
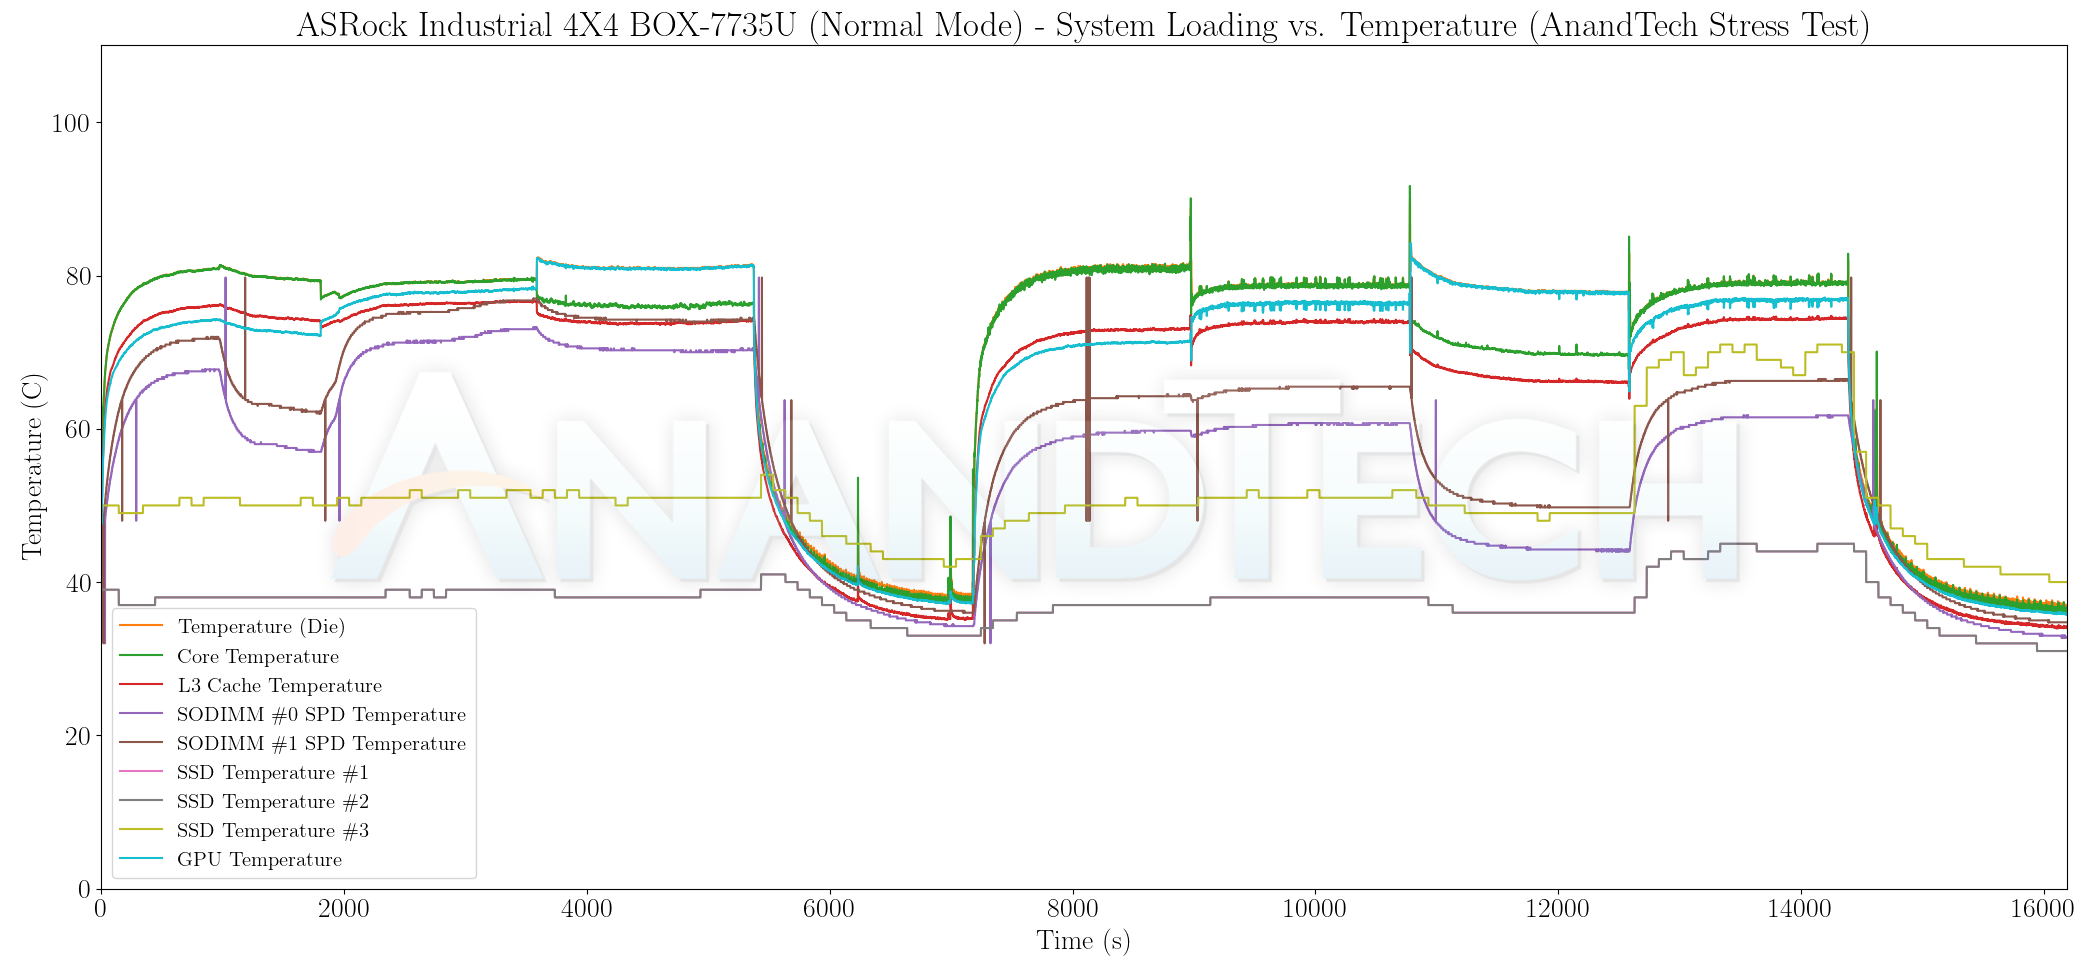
The thermal solution manages to keep the internal temperatures south of 80C with the processor configured for a 28W TDP. We see the package power remaining constant at 28W for the most part. There is some discrepancy with the internal measurements when AIDA64 attempts to activate all stress components, but it is clear that the internal power consumption by the package can't exceed the at-wall number. In any case, we see the skin-temperature aware power measurement (APU STAPM) settle nicely at 28W throughout the stress period.

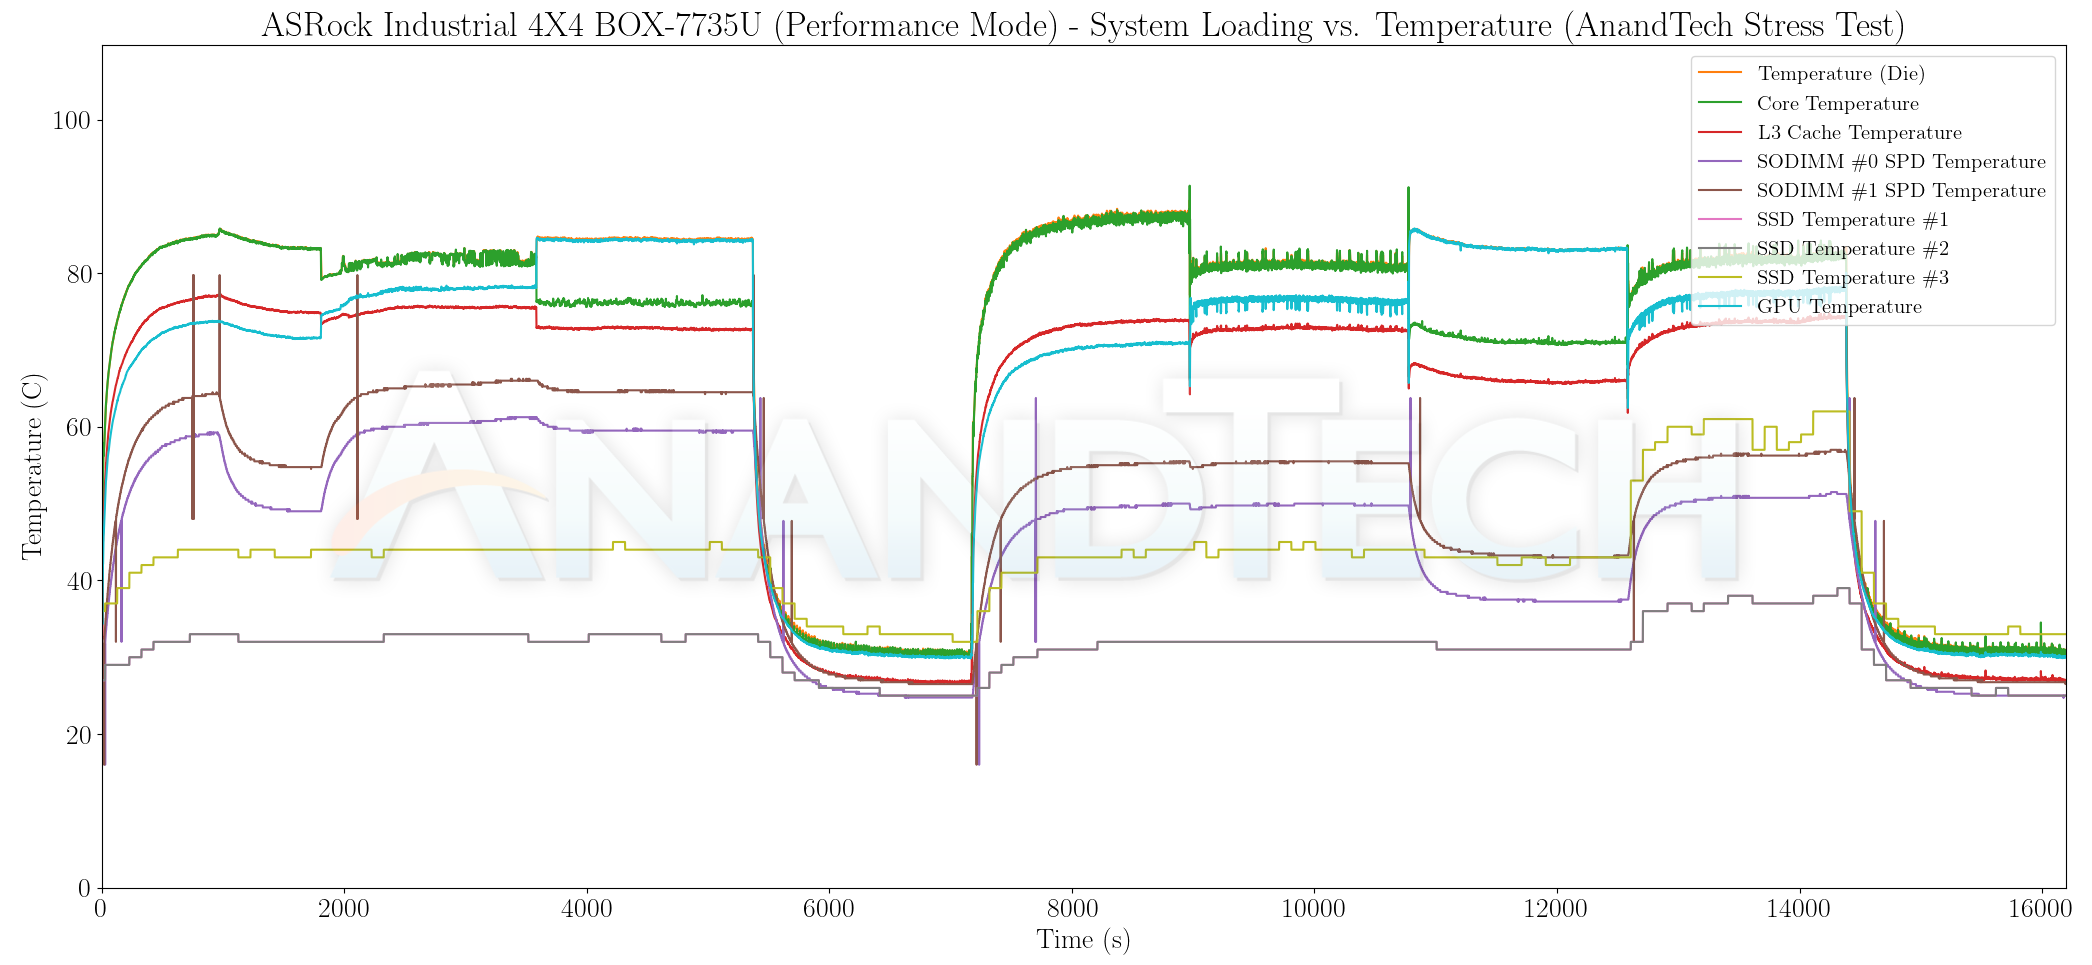
Configuring the processor with a 42W TDP results in the fan running at full tilt. However, the temperature does go slightly north of 85C. That is still below the thermal throttling region, and we don't see any effect on the package power numbers or the APU STAPM values. The at-wall numbers are also stable throughout the stress regions.
Miscellaneous Aspects and Concluding Remarks
Networking and storage are aspects that may be of vital importance in specific PC use-cases. The ASRock 4X4 BOX-7735U comes with dual LAN ports. From a management perspective, the system is DASH-enabled. This is a huge plus for IT departments to have an out-of-band management path for deployment and maintenance. The WLAN component is with the AMD-branded Mediatek-based Wi-Fi 6E solution that was also used in the previous generation 4X4 BOX-5800U.
On the storage side, we were able to finally test a Gen 4 SSD in a UCFF AMD system. Interestingly, we reviewed the Arena Canyon NUC recently with exactly the same SSD model. From a benchmarking perspective, we provide results from the WPCstorage test of SPECworkstation 3.1. This benchmark replays access traces from various programs used in different verticals and compares the score against the one obtained with a 2017 SanDisk 512GB SATA SSD in the SPECworkstation 3.1 reference system.
| SPECworkstation 3.1.0 - WPCstorage SPEC Ratio Scores | |||
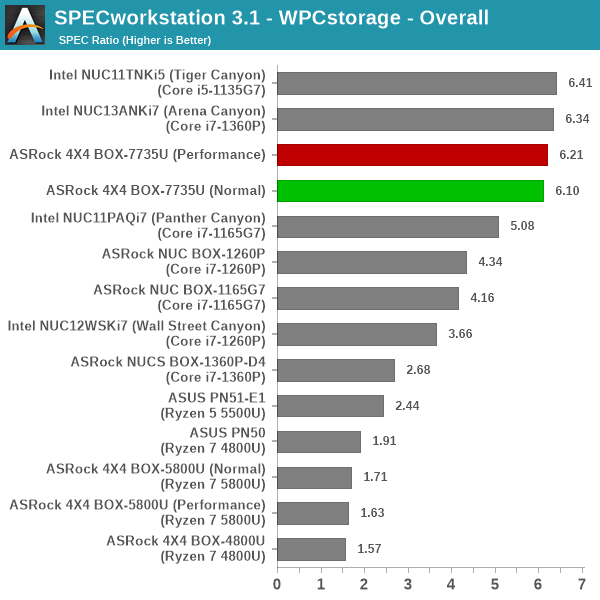
The graphs above present results for different verticals, as grouped by SPECworkstation 3.1. The storage workload consists of 60 subtests. Access traces from CFD solvers and programs such as Catia, Creo, and Soidworks come under 'Product Development'. Storage access traces from the NAMD and LAMMPS molecular dynamics simulator are under the 'Life Sciences' category. 'General Operations' includes access traces from 7-Zip and Mozilla programs. The 'Energy' category replays traces from the energy-02 SPECviewperf workload. The 'Media and Entertainment' vertical includes Handbrake, Maya, and 3dsmax. Given that the comparison is between a wide range of SSDs in the systems - including both Gen 3 and Gen 4 NVMe, the relative numbers for most workloads are not surprising. The slight drop in performance of the PM9A1 in the 4X4 BOX-7735U/D5 compared to the Arena Canyon NUC can probably be put down to thermal throttling. ASRock Industrial doesn't provide any thermal solution for the M.2 SSD, while the Intel NUCs have an appropriate thermal pad as well as metal heat sink to alleviated that concern.
USB4 Performance Preview
The last few years have seen a lot of tier-one vendors release AMD-based mini-PCs. However, the lack of Thunderbolt support had remained a sore point despite compelling CPU performance and power efficiency numbers compared to the equivalent Intel-based offerings. After Intel contributed Thunderbolt specifications to the USB-IF, and USB4 was introduced, it was only a matter of time before AMD-based offerings matched up on the external I/O front. With Rembrandt-R, things are finally coming together. Both Type-C ports in the front panel of the 4X4 BOX-7735U/D5 support USB4 with PCIe tunneling.
The key test for this, in our opinion, is an eGPU enclosure. We dusted off our review sample of the PowerColor Gaming Station and the Radeon RX Vega 56 Nano and hooked it up to one of the Type-C ports of the 4X4 BOX-7735U/D5.

In our limited testing, we found things to working well for the most part. The eGPU could be configured as the sole / primary display driver for the system, and we were able to process the 3DMark PCI Express feature test. The effective host-to-device bandwidth turned out to be 2.74 GBps (21.92 Gbps), which corresponds nicely to the 22 Gbps unidirectional effective PCIe tunneling bandwidth mentioned in the Thunderbolt 3 specifications. We plan to investigate the USB4 functionality further in a future article.
Closing Thoughts
The ASRock Industrial 4X4 BOX-7735U/D5 provided us with the opportunity to evaluate a high-end AMD-based UCFF PC with premium features. The Rembrandt-R platform exceeded our expectations with top-notch iGPU performance and USB4 40 Gbps support. ASRock Industrial has managed to bring the 4X4 BOX-7735U/D5 to the market relatively quickly after AMD's introduction of the SoCs.
While the BIOS toggle to set the CPU operation mode to either 'Normal' or 'Performance' is appreciated, we believe ASRock Industrial has taken a shortcut here. In the performance mode, the fan is set to run at 100% duty cycle - even when the system is at idle. The company could have delivered support for similar TDP values with a better noise profile by allowing for fine-grained fan speed control based on SoC temperature. ASRock's BIOS for their consumer motherboards (and even the DeskMini series) has such support - so it is not entirely unreasonable of us to expect ASRock Industrial to deliver a similar feature. On the hardware front, we would like to see support for a better thermal solution for the M.2 SSD. Replacement of the USB 2.0 ports in the rear panel with USB 3.2 Gen 2 ports would also be good to bring the I/O on par with Intel-based offerings.
While we have seen significant improvement on the iGPU performance side, the drivers could probably behave a bit better for certain multimedia workloads. Still, it is a major improvement over the previous generations / driver versions when the application would end up crashing.
All things considered, the new 4X4 BOX-7735U/D5's value proposition can only be discussed after we get clarity on the pricing. ASRock Industrial had indicated earlier that the system would be available for $650 (UPDATE: retailed on April 17, 2023 at $630), but the product is yet to hit the e-tailer shelves. Around $650, we will have no qualms in recommending the system as an alternative to the Arena Canyon NUC. Given the architectural differences (the heterogeneous nature of Raptor Lake-P), there will always be workloads that favor one over the other. Considering the user experience with the system as a whole, the Intel NUC's BIOS is quite sleek and has fine-grained control over TDP values, unlike the ASRock Industrial's NUC(S) BOX and 4X4 BOX systems. That said, the USB4 integration in Rembrandt-R has rendered Intel's Thunderbolt advantage moot for most practical purposes. The 4X4 BOX-7735U/D5 also comes with extra features (such as DASH management). Combined with the lower price point, ASRock Industrial's Rembrandt-R system has a slight edge over the Arena Canyon NUC in the market.
In our evaluation, the Arena Canyon NUC comes out on top in a majority of the CPU-centric workloads (including the multi-threaded ones that used to be AMD's forte in the past few years). However, the GPU-centric workloads have ended up with a swing in the opposite direction and AMD has again regained the spot it once occupied in the pre-Zen days. The performance crown for different types of workloads has been passing back and forth between AMD and Intel over the last few processor generations. This is particularly evident in the UCFF market where it is not possible to drastically increase core counts and claim victory in multi-threaded benchmarks. At the same time, both vendors are working to make their platforms more power- and energy-efficient. It is great news for consumers to finally have such close competition between the two x86 vendors after a long time.


